


.png)


The Solar Dynamics Observatory (SDO) provides views of the Sun in detail never before possible. Launched on February 11, 2010, SDO provides ultra high-definition imagery of the Sun in 13 different wavelengths, utilizing two imaging instruments, the Atmospheric Imaging Assembly (AIA) instrument and the Helioseismic and Magnetic Imager (HMI). Each wavelength is based on one or two types of ions -- though slightly longer and shorter wavelengths produced by other ions are also part of the picture. Each wavelength was chosen to highlight a particular part of the sun's atmosphere, from the solar surface to the upper reaches of the sun's corona.
For more technical information about which ions produce which wavelengths, scroll down to the descriptions for each, below the graphic.
For more technical information about which ions produce which wavelengths, scroll down to the descriptions for each, below the graphic.

Caption: Each of the wavelengths observed by NASA's Solar Dynamics Observatory, or SDO, was chosen to emphasize a specific aspect of the sun's surface or atmosphere. This image shows imagery both from the Advanced Imaging Assembly (AIA), which helps scientists observe how solar material moves around the sun's atmosphere, and the Helioseismic and Magnetic Imager (HMI), which focuses on the movement and magnetic properties of the sun's surface. More details for each wavelength and links to real-time SDO imagery follows. Credit: NASA/SDO/GSFC
NOTE: If the real-time images (below right) appear black, the satellite data feed is temporarily unavailable. Please check back later.
The order of descriptions corresponds to the above graphic, starting at the top left.
The order of descriptions corresponds to the above graphic, starting at the top left.
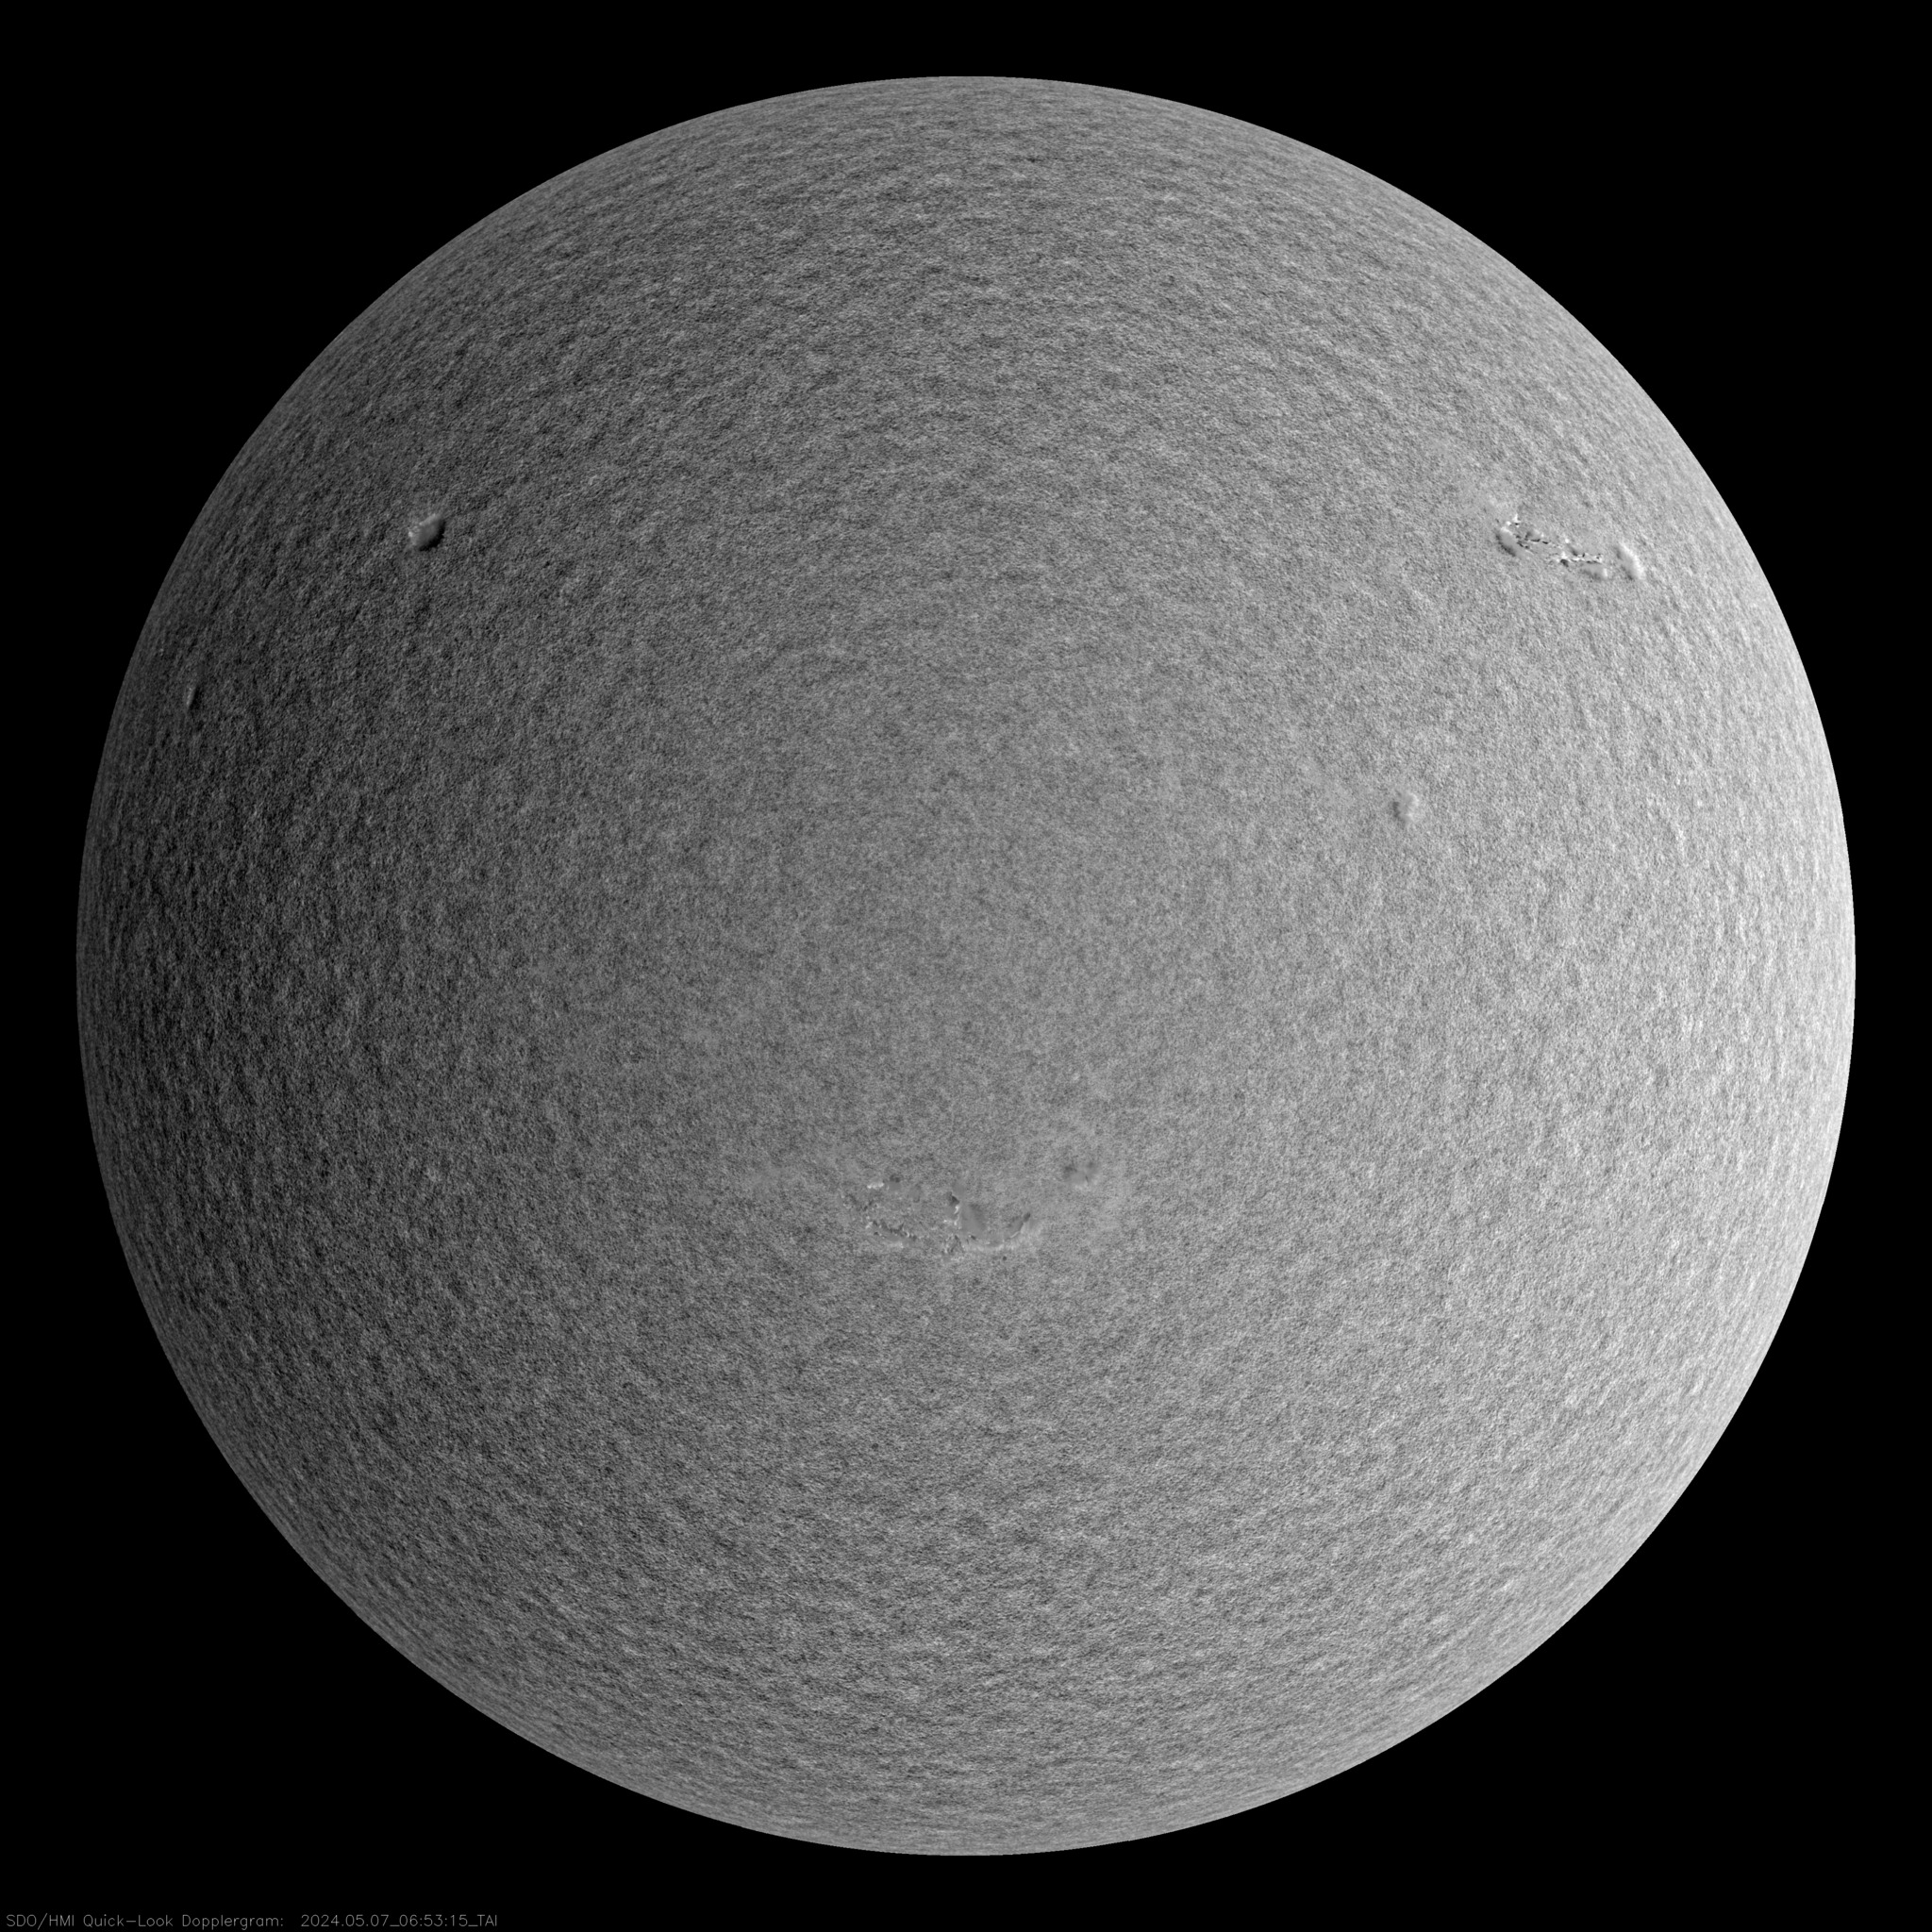
HMI Dopplergram
Dopplergrams provide maps of velocity on the sun's surface. Solar Region: Photosphere
› View real-time HMI Dopplergram
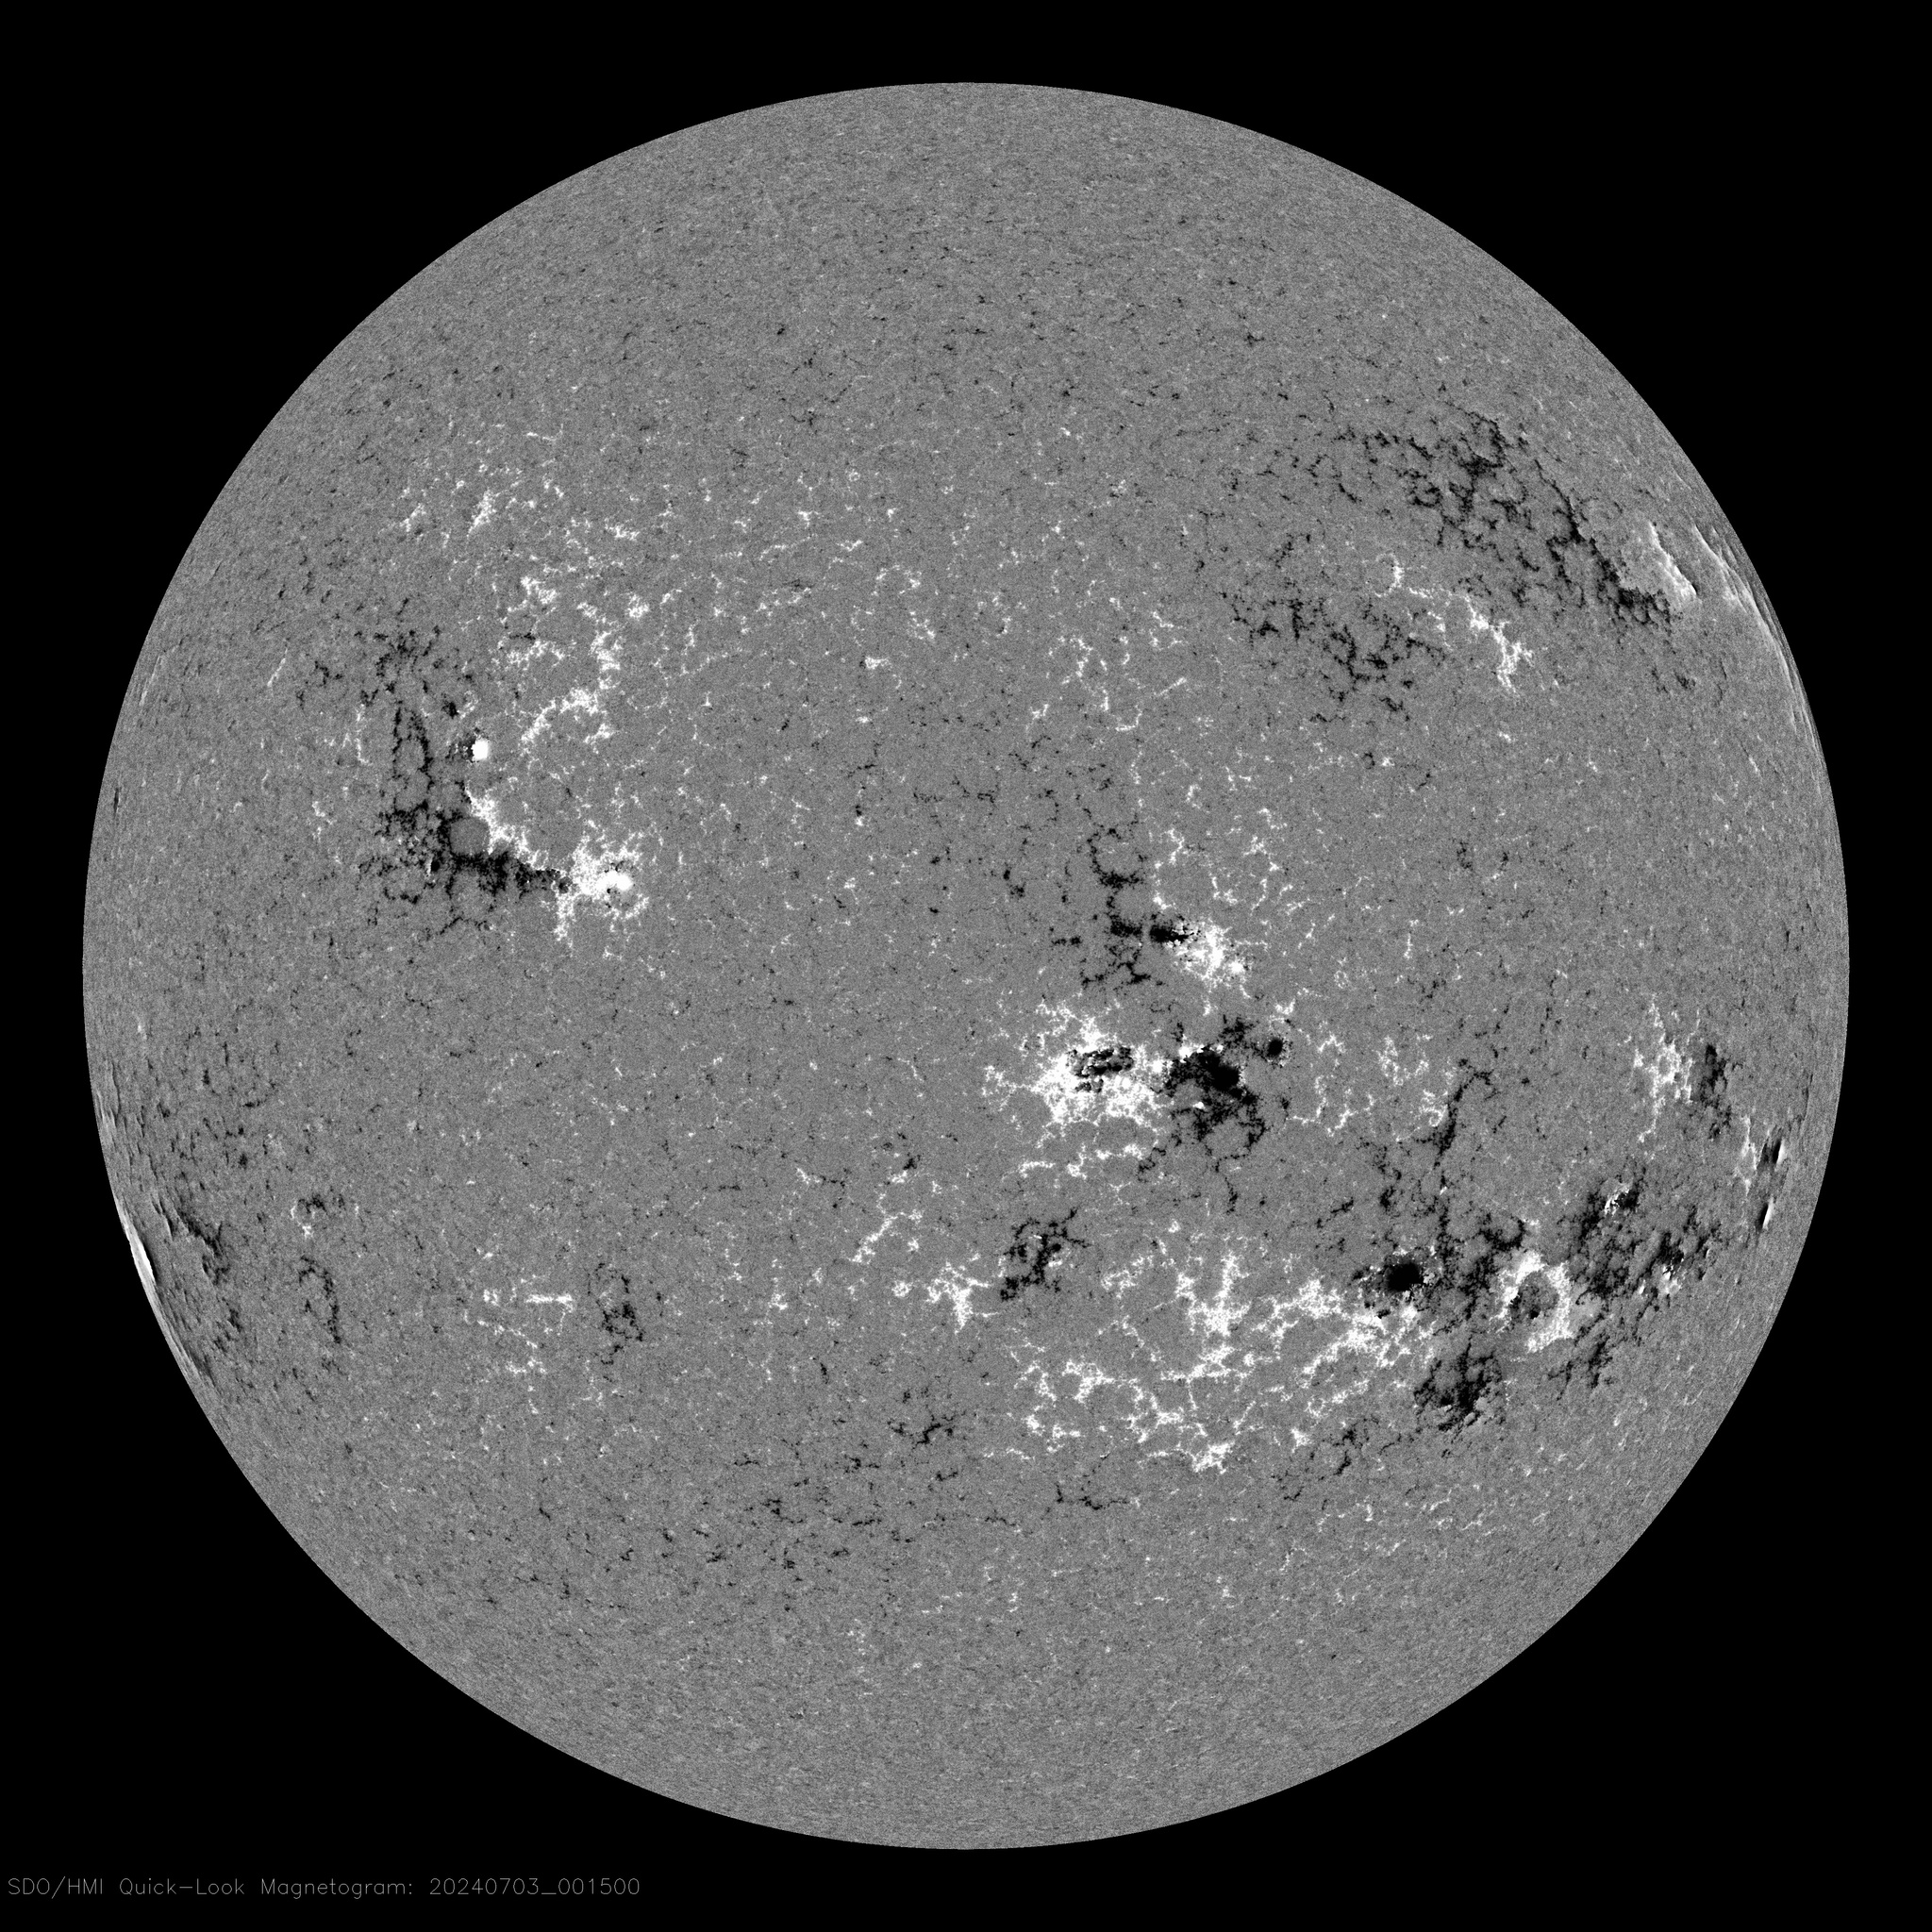 HMI Magnetogram
Magnetograms show maps of the magnetic field on the sun’s surface, with black showing magnetic field lines pointing away from Earth, and white showing magnetic field lines coming toward Earth. Solar Region: Photosphere
› View real-time HMI Magnetogram
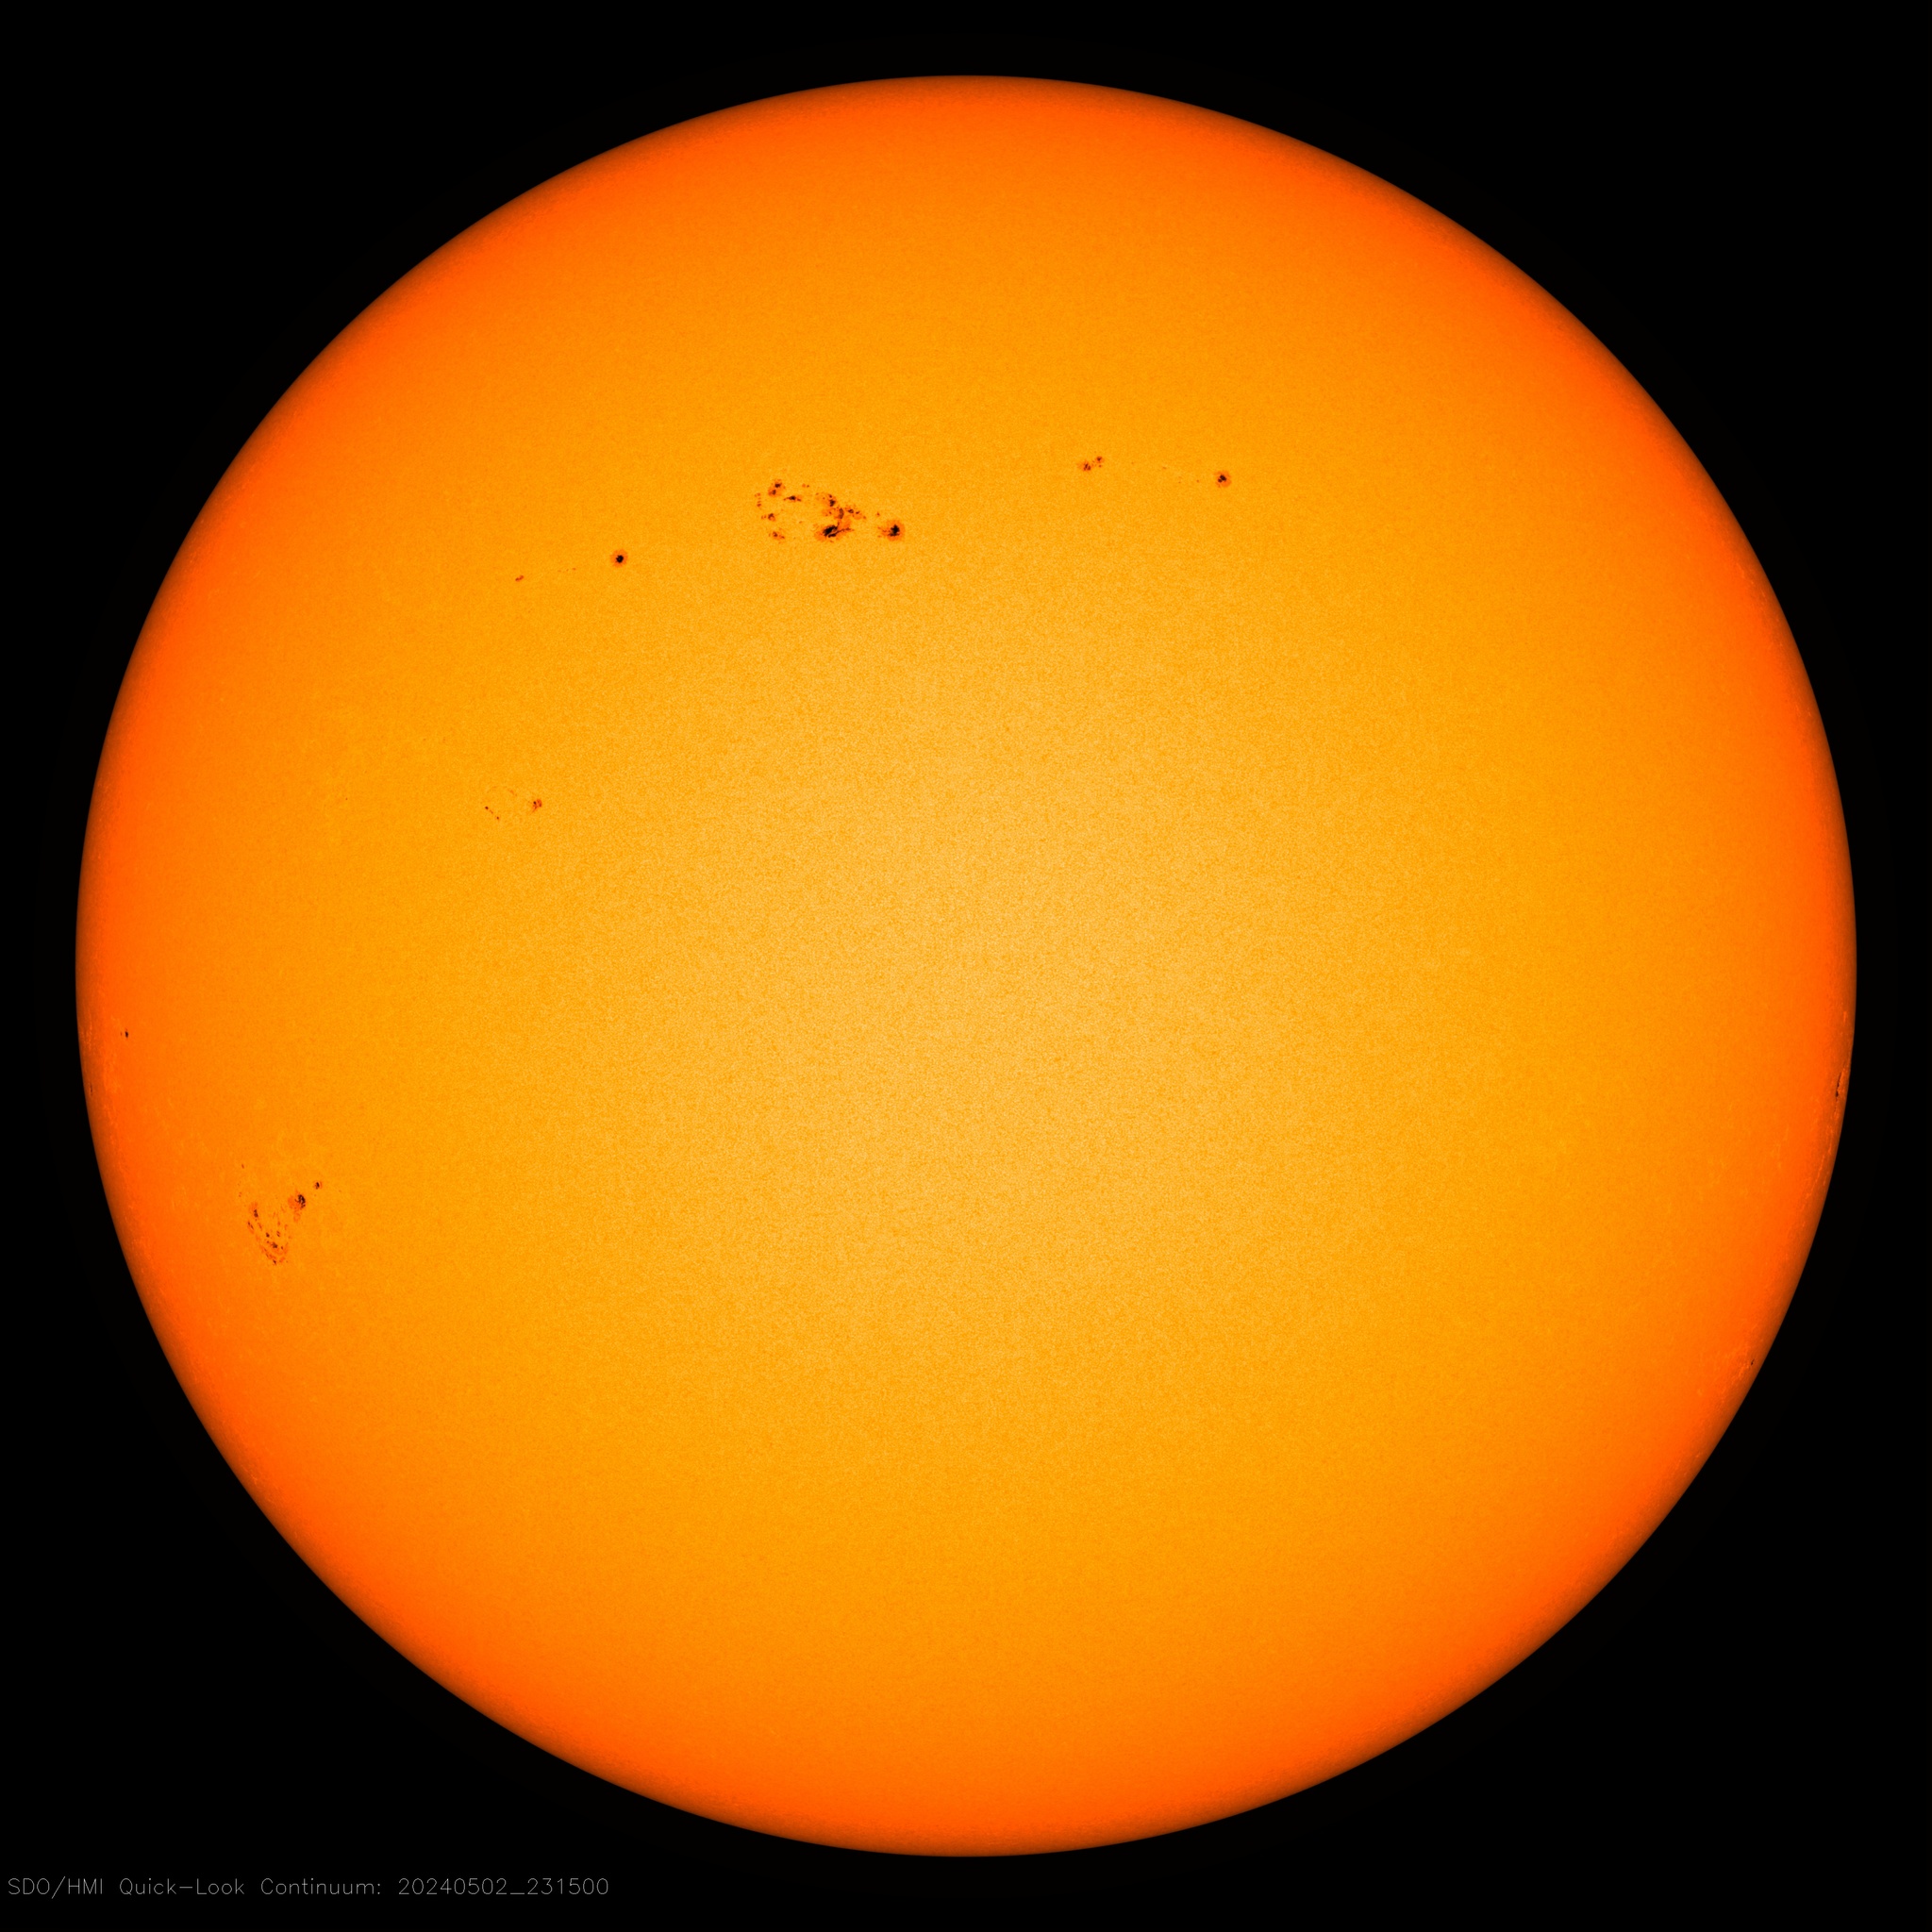 HMI Continuum
Continuums provide photographs of the solar surface, incorporating a broad range of visible light. Solar Region: Photosphere
› View real-time HMI Continuum
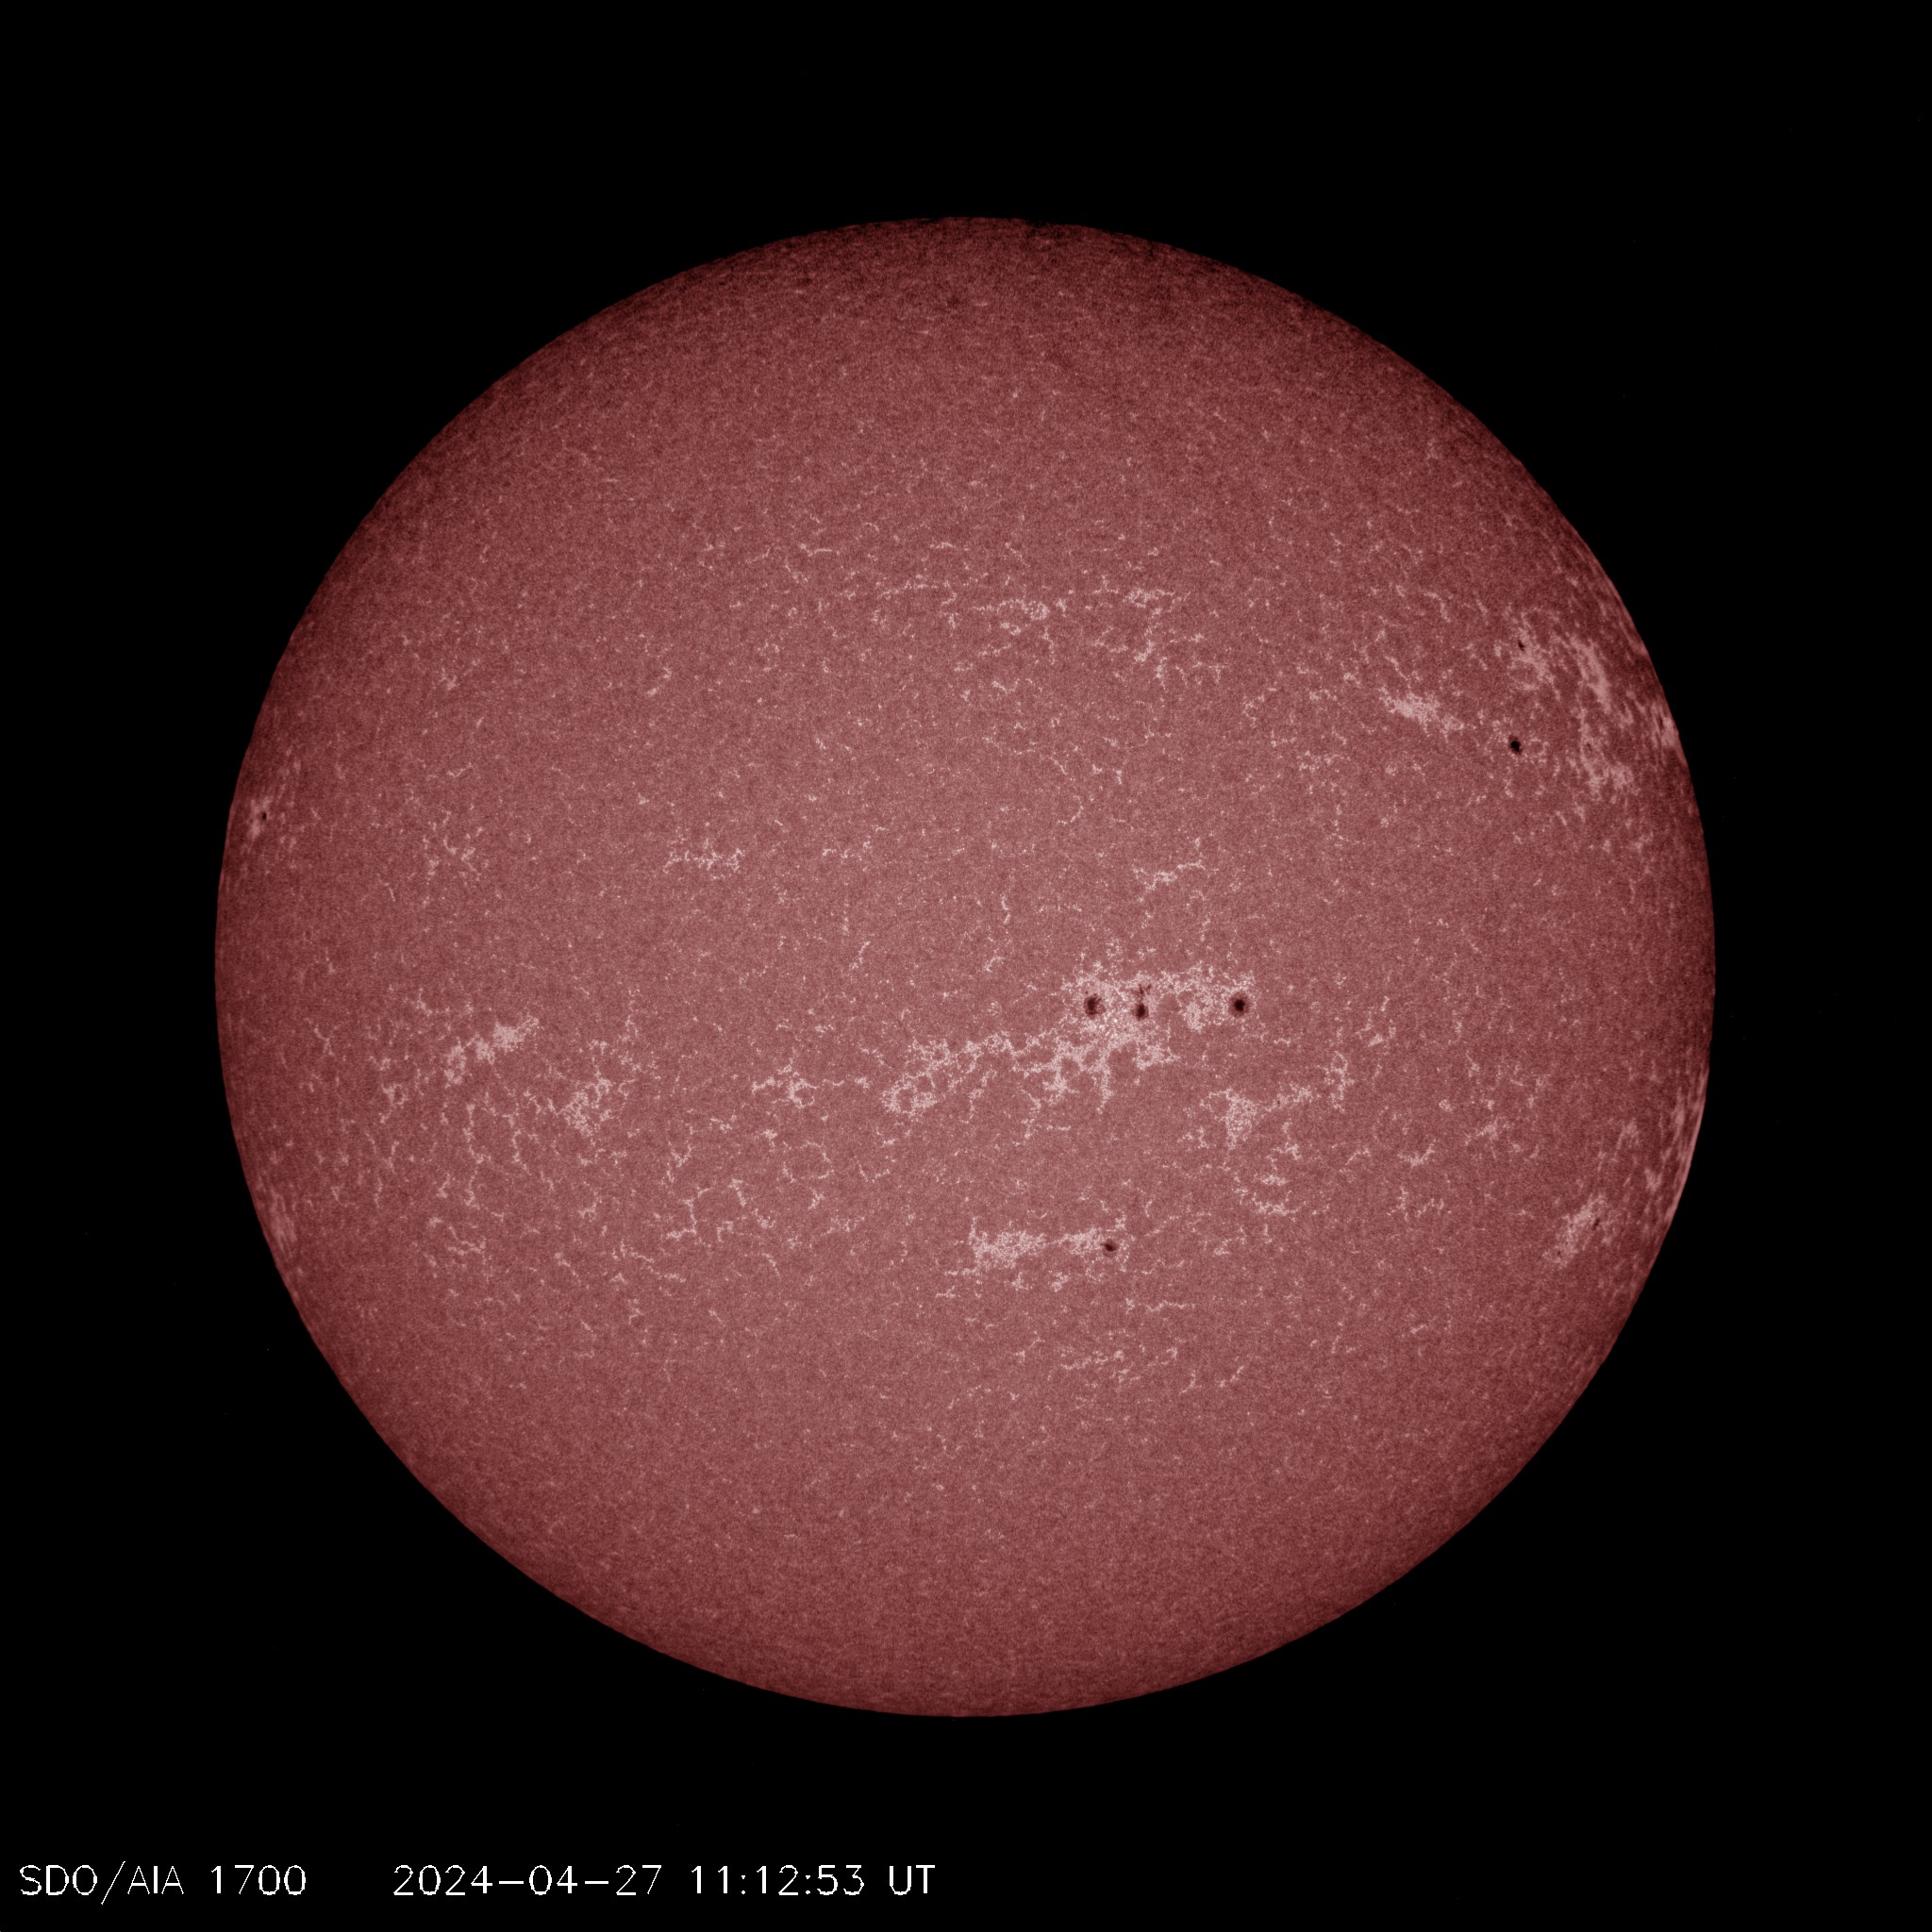 AIA 1700
Ultraviolet light continuum, shows the surface of the sun. As well as a layer of the sun's atmosphere called the chromosphere, which lies just above the photosphere and is where the temperature begins rising. Temperatures: 4500 Kelvin, Solar Region: Photosphere/Chromosphere
› View real-time AIA 1700
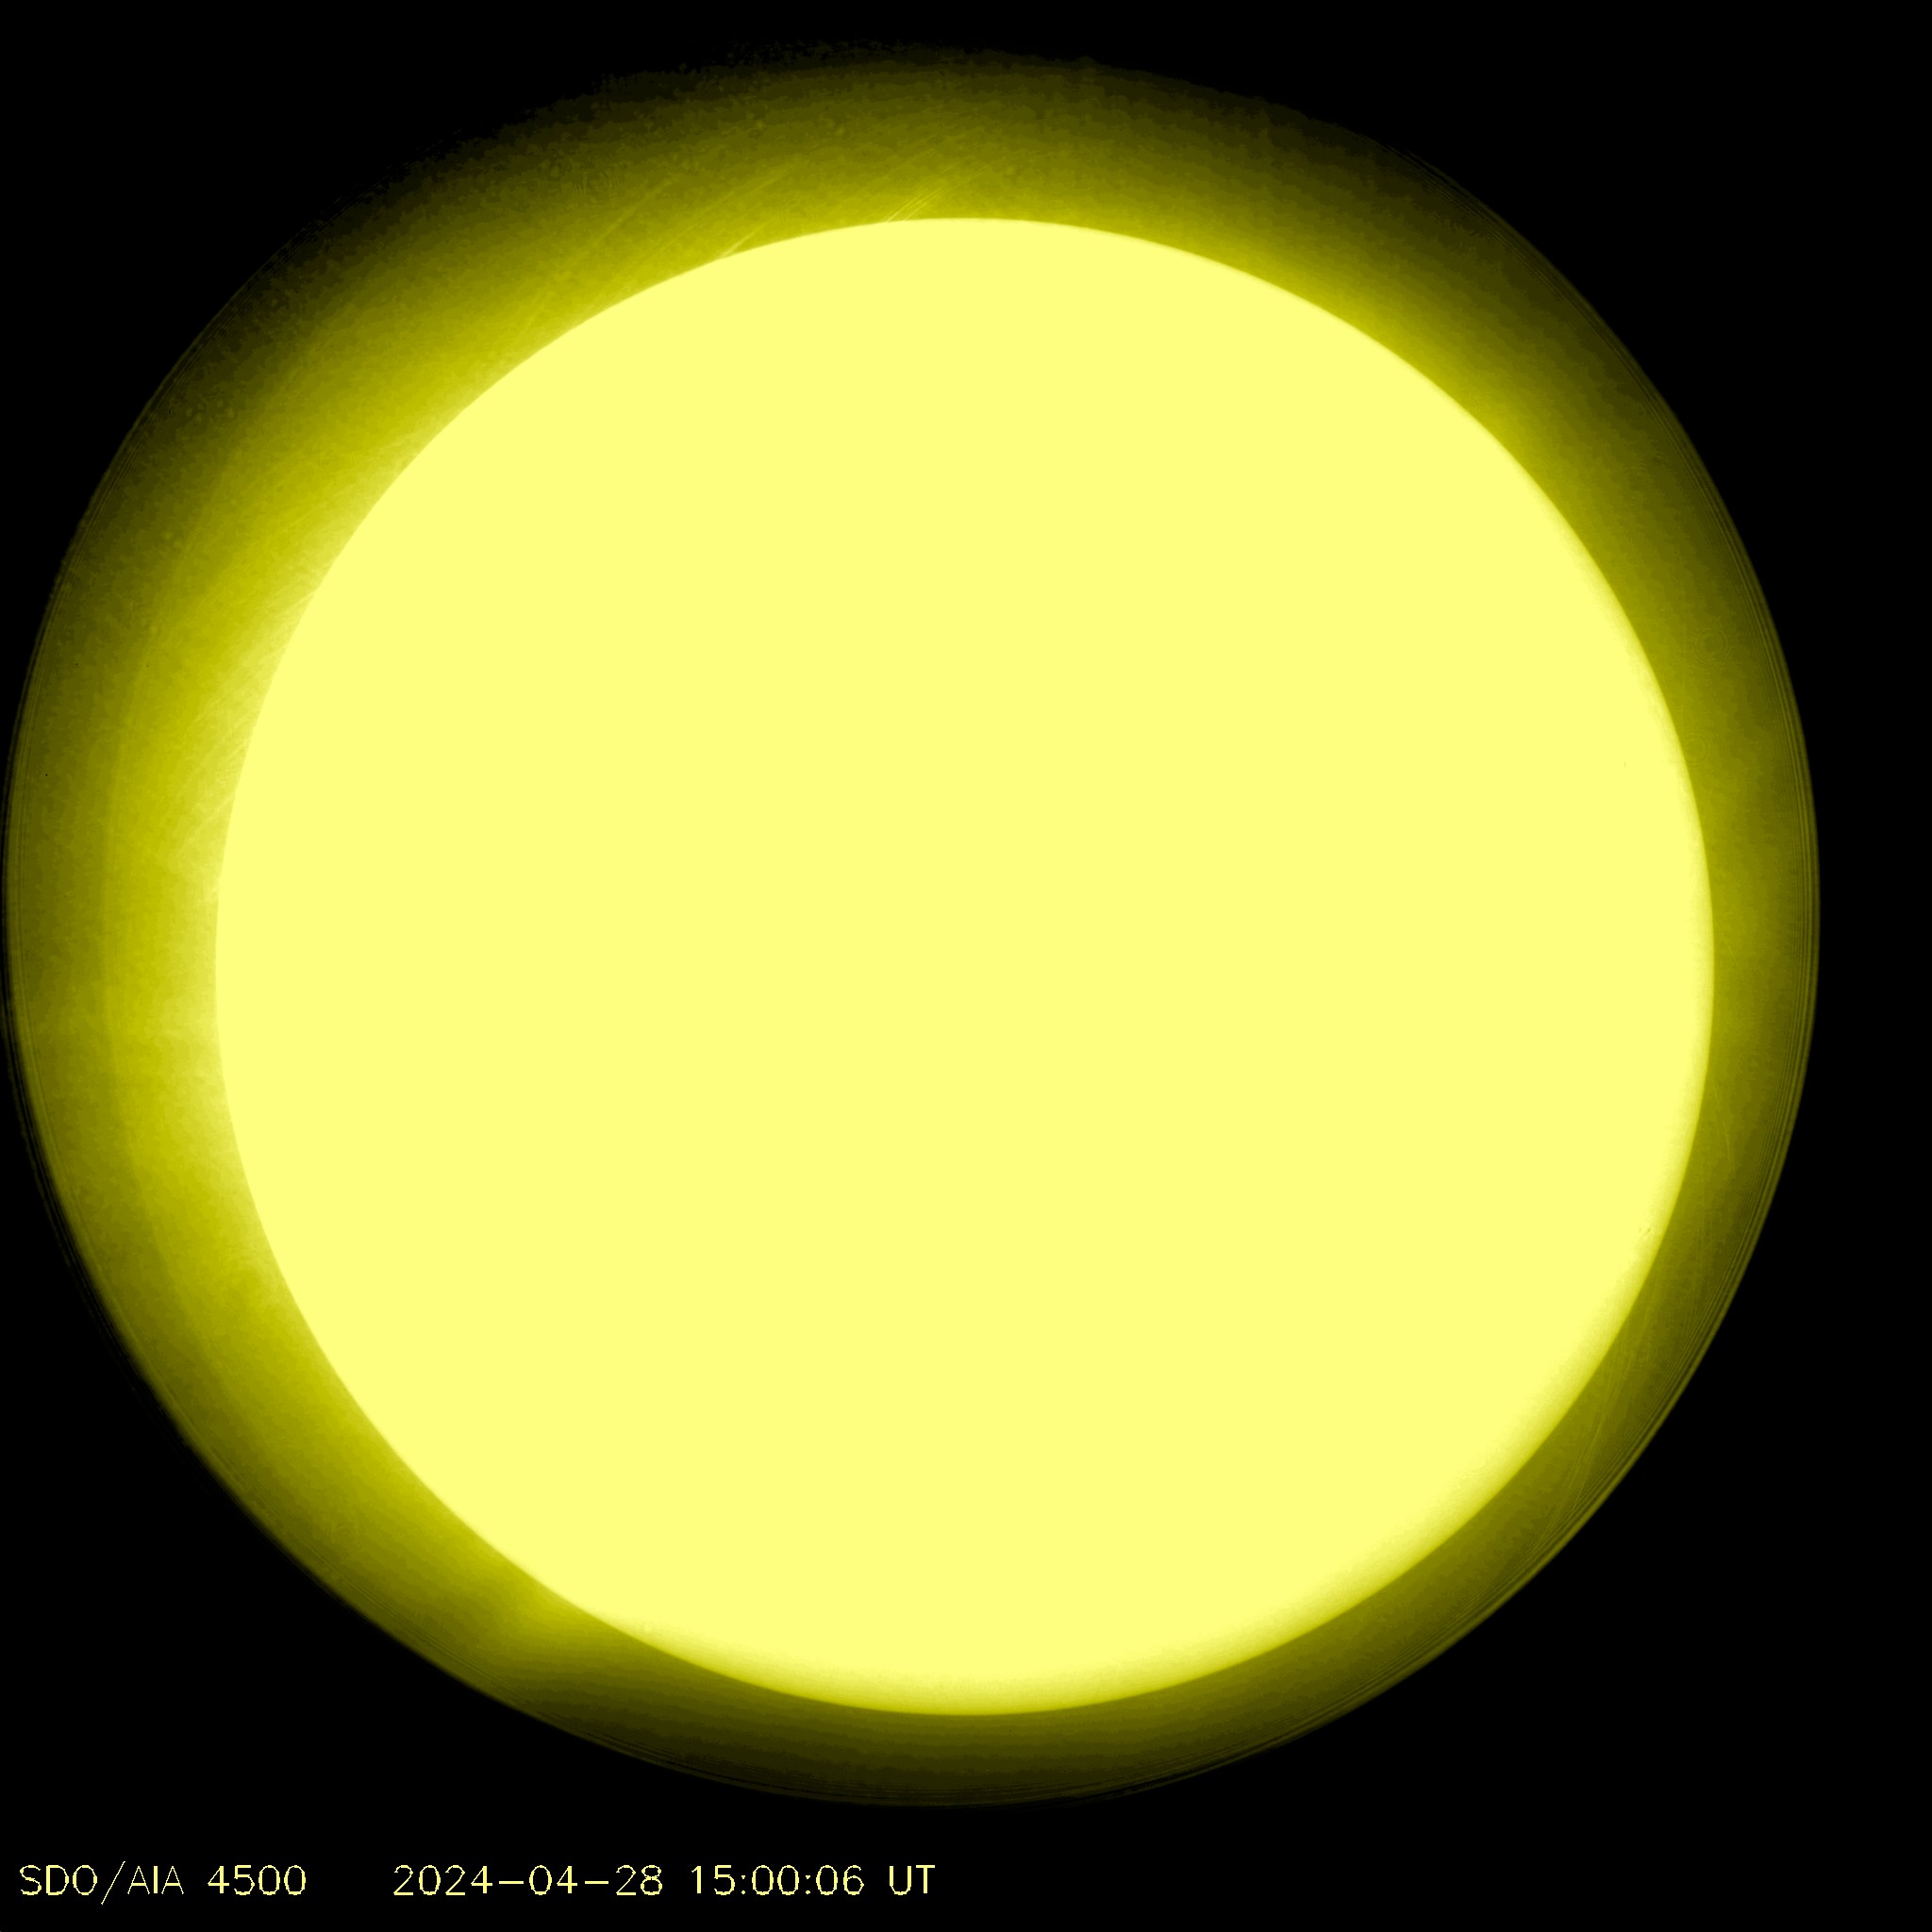 AIA 4500
White light continuum showing the sun's surface or photosphere. Temperatures: 6000 Kelvin, Solar Region: Photosphere
› View real-time AIA 4500
 AIA 1600
Emitted by carbon-4 (C IV) at around 10,000 Kelvin. C IV at these temperatures is present in the upper photosphere and what's called the transition region, a region between the chromosphere and the upper most layer of the sun's atmosphere called the corona. The transition region is where the temperature rapidly rises. SDO images of this wavelength are typically colorized in dark yellow. Solar Region: Upper Photosphere/Transition Region
› View real-time AIA 1600
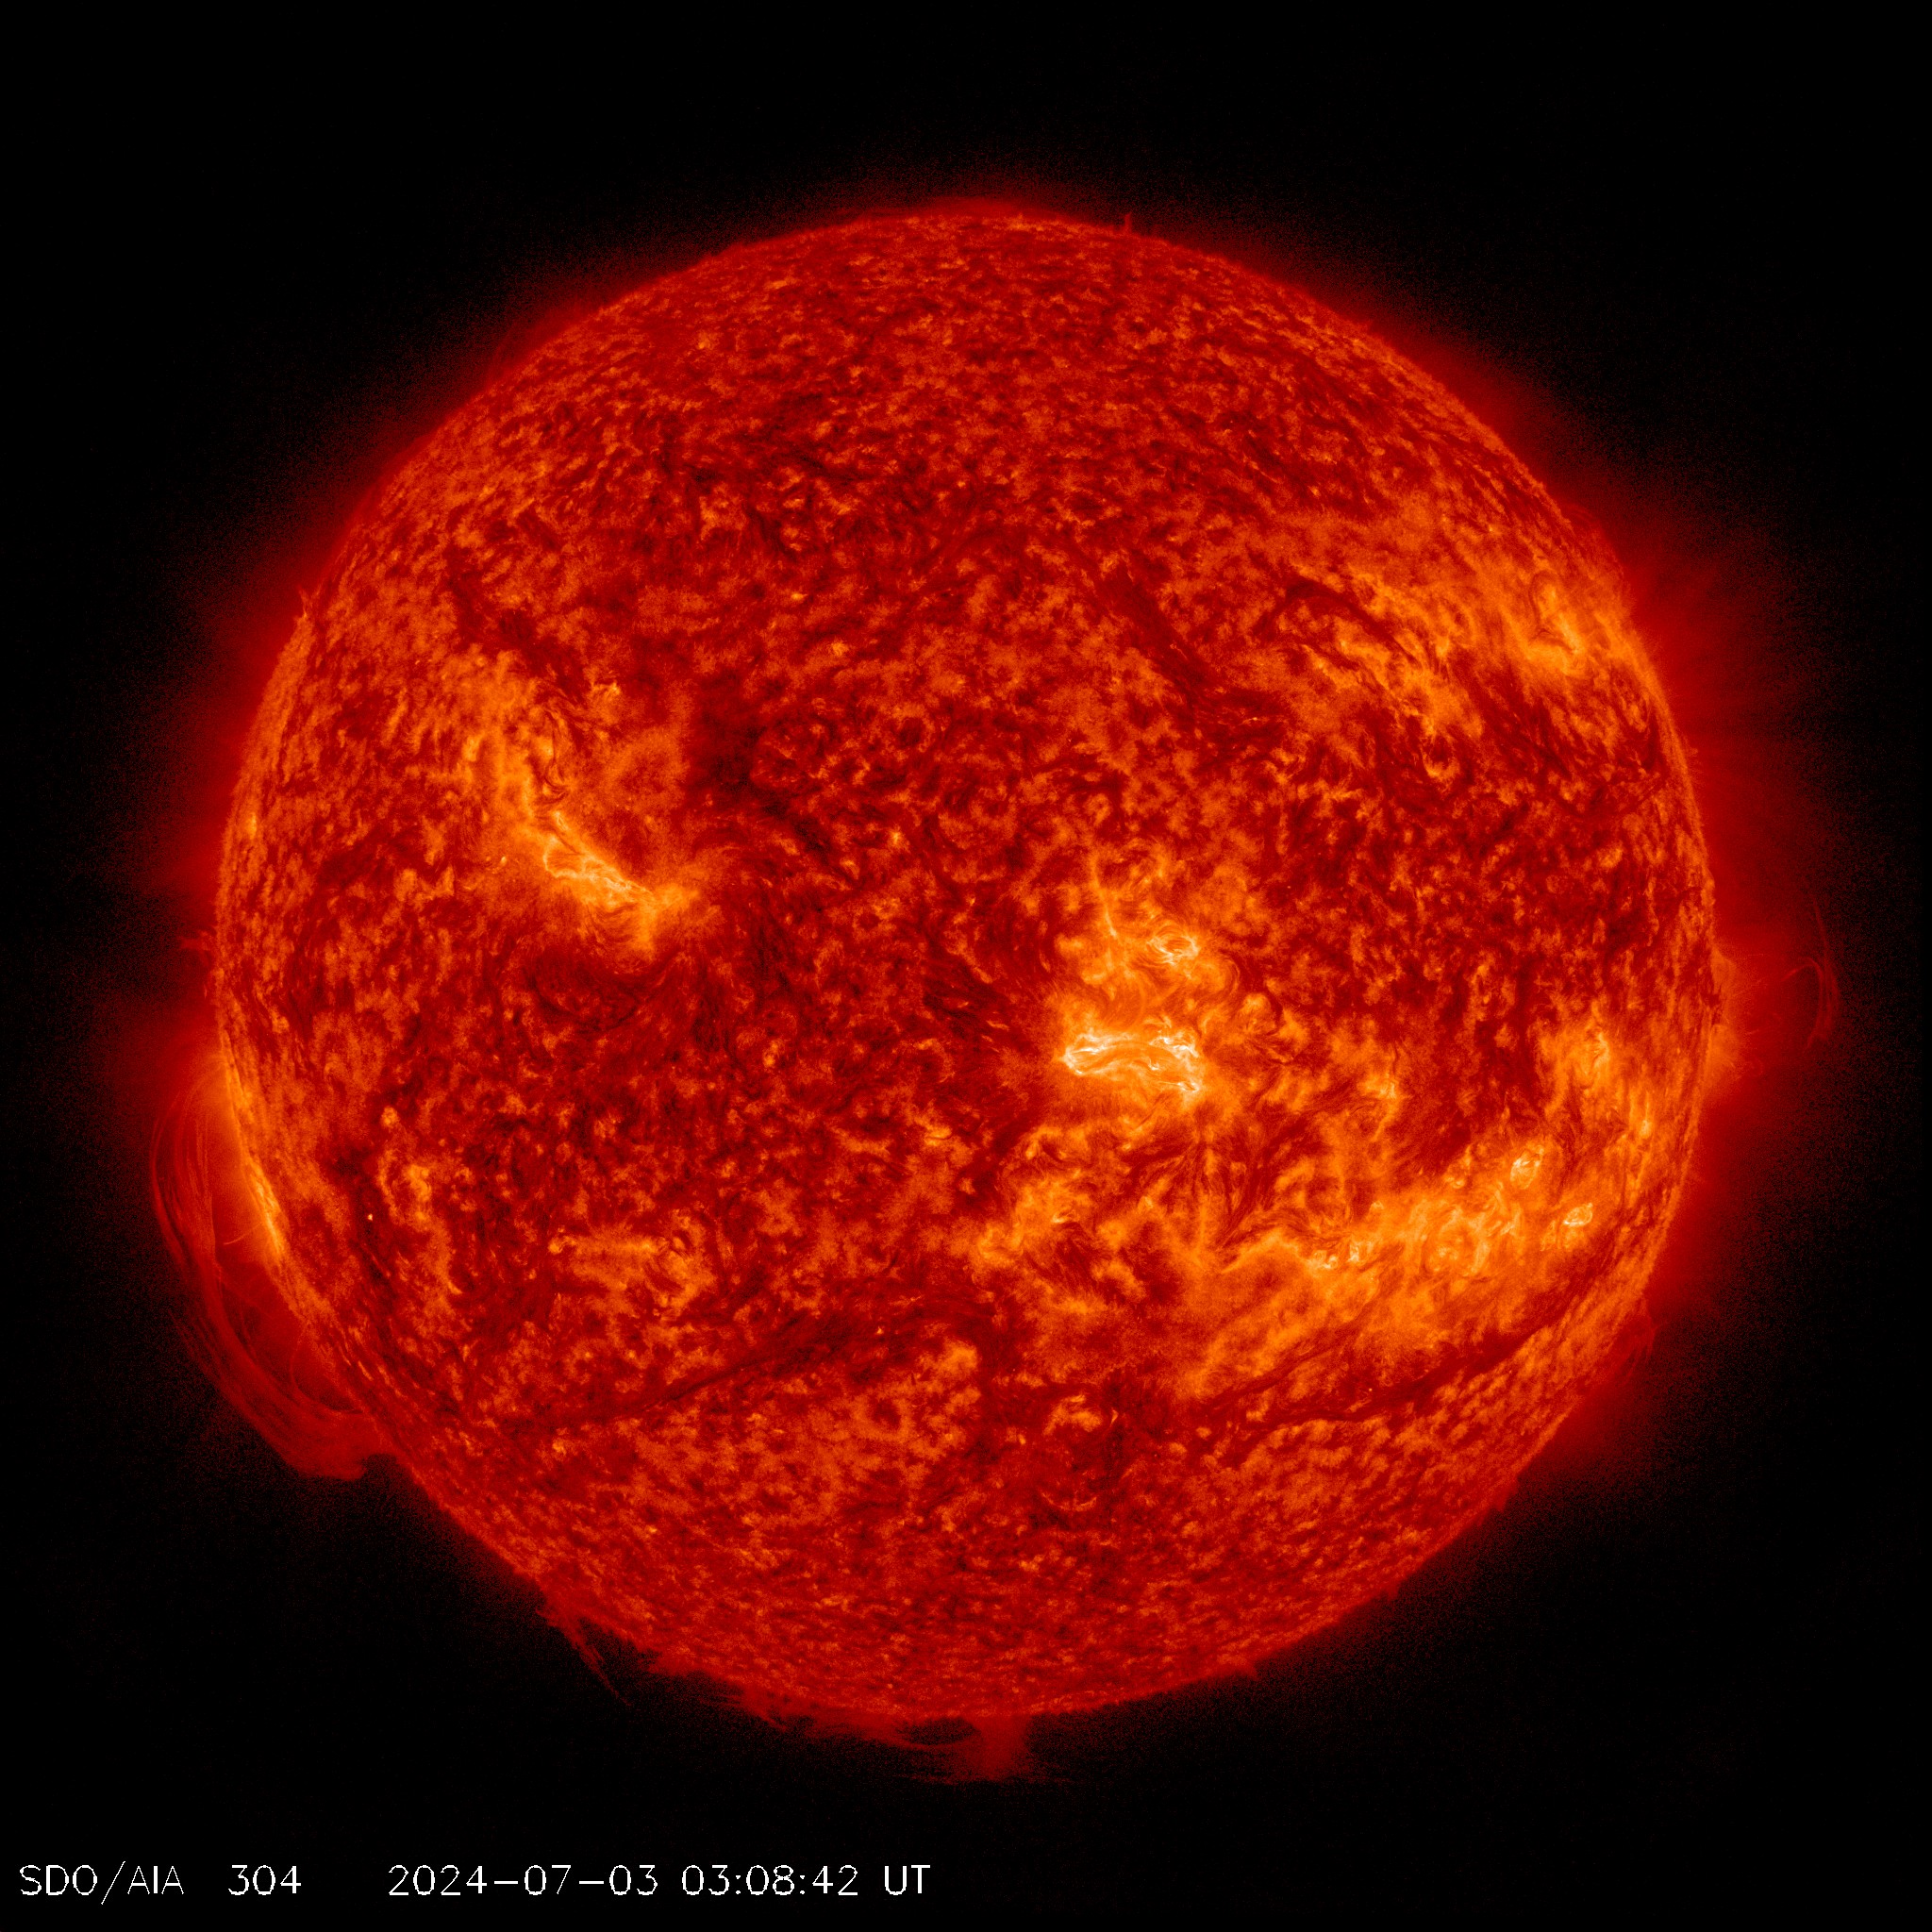 AIA 304
Emitted by helium-2 (He II) at around 50,000 Kelvin. This light is emitted from the chromosphere and transition region. SDO images of this wavelength are typically colorized in red. Solar Region: Transition Region/Chromasphere
› View real-time AIA 304
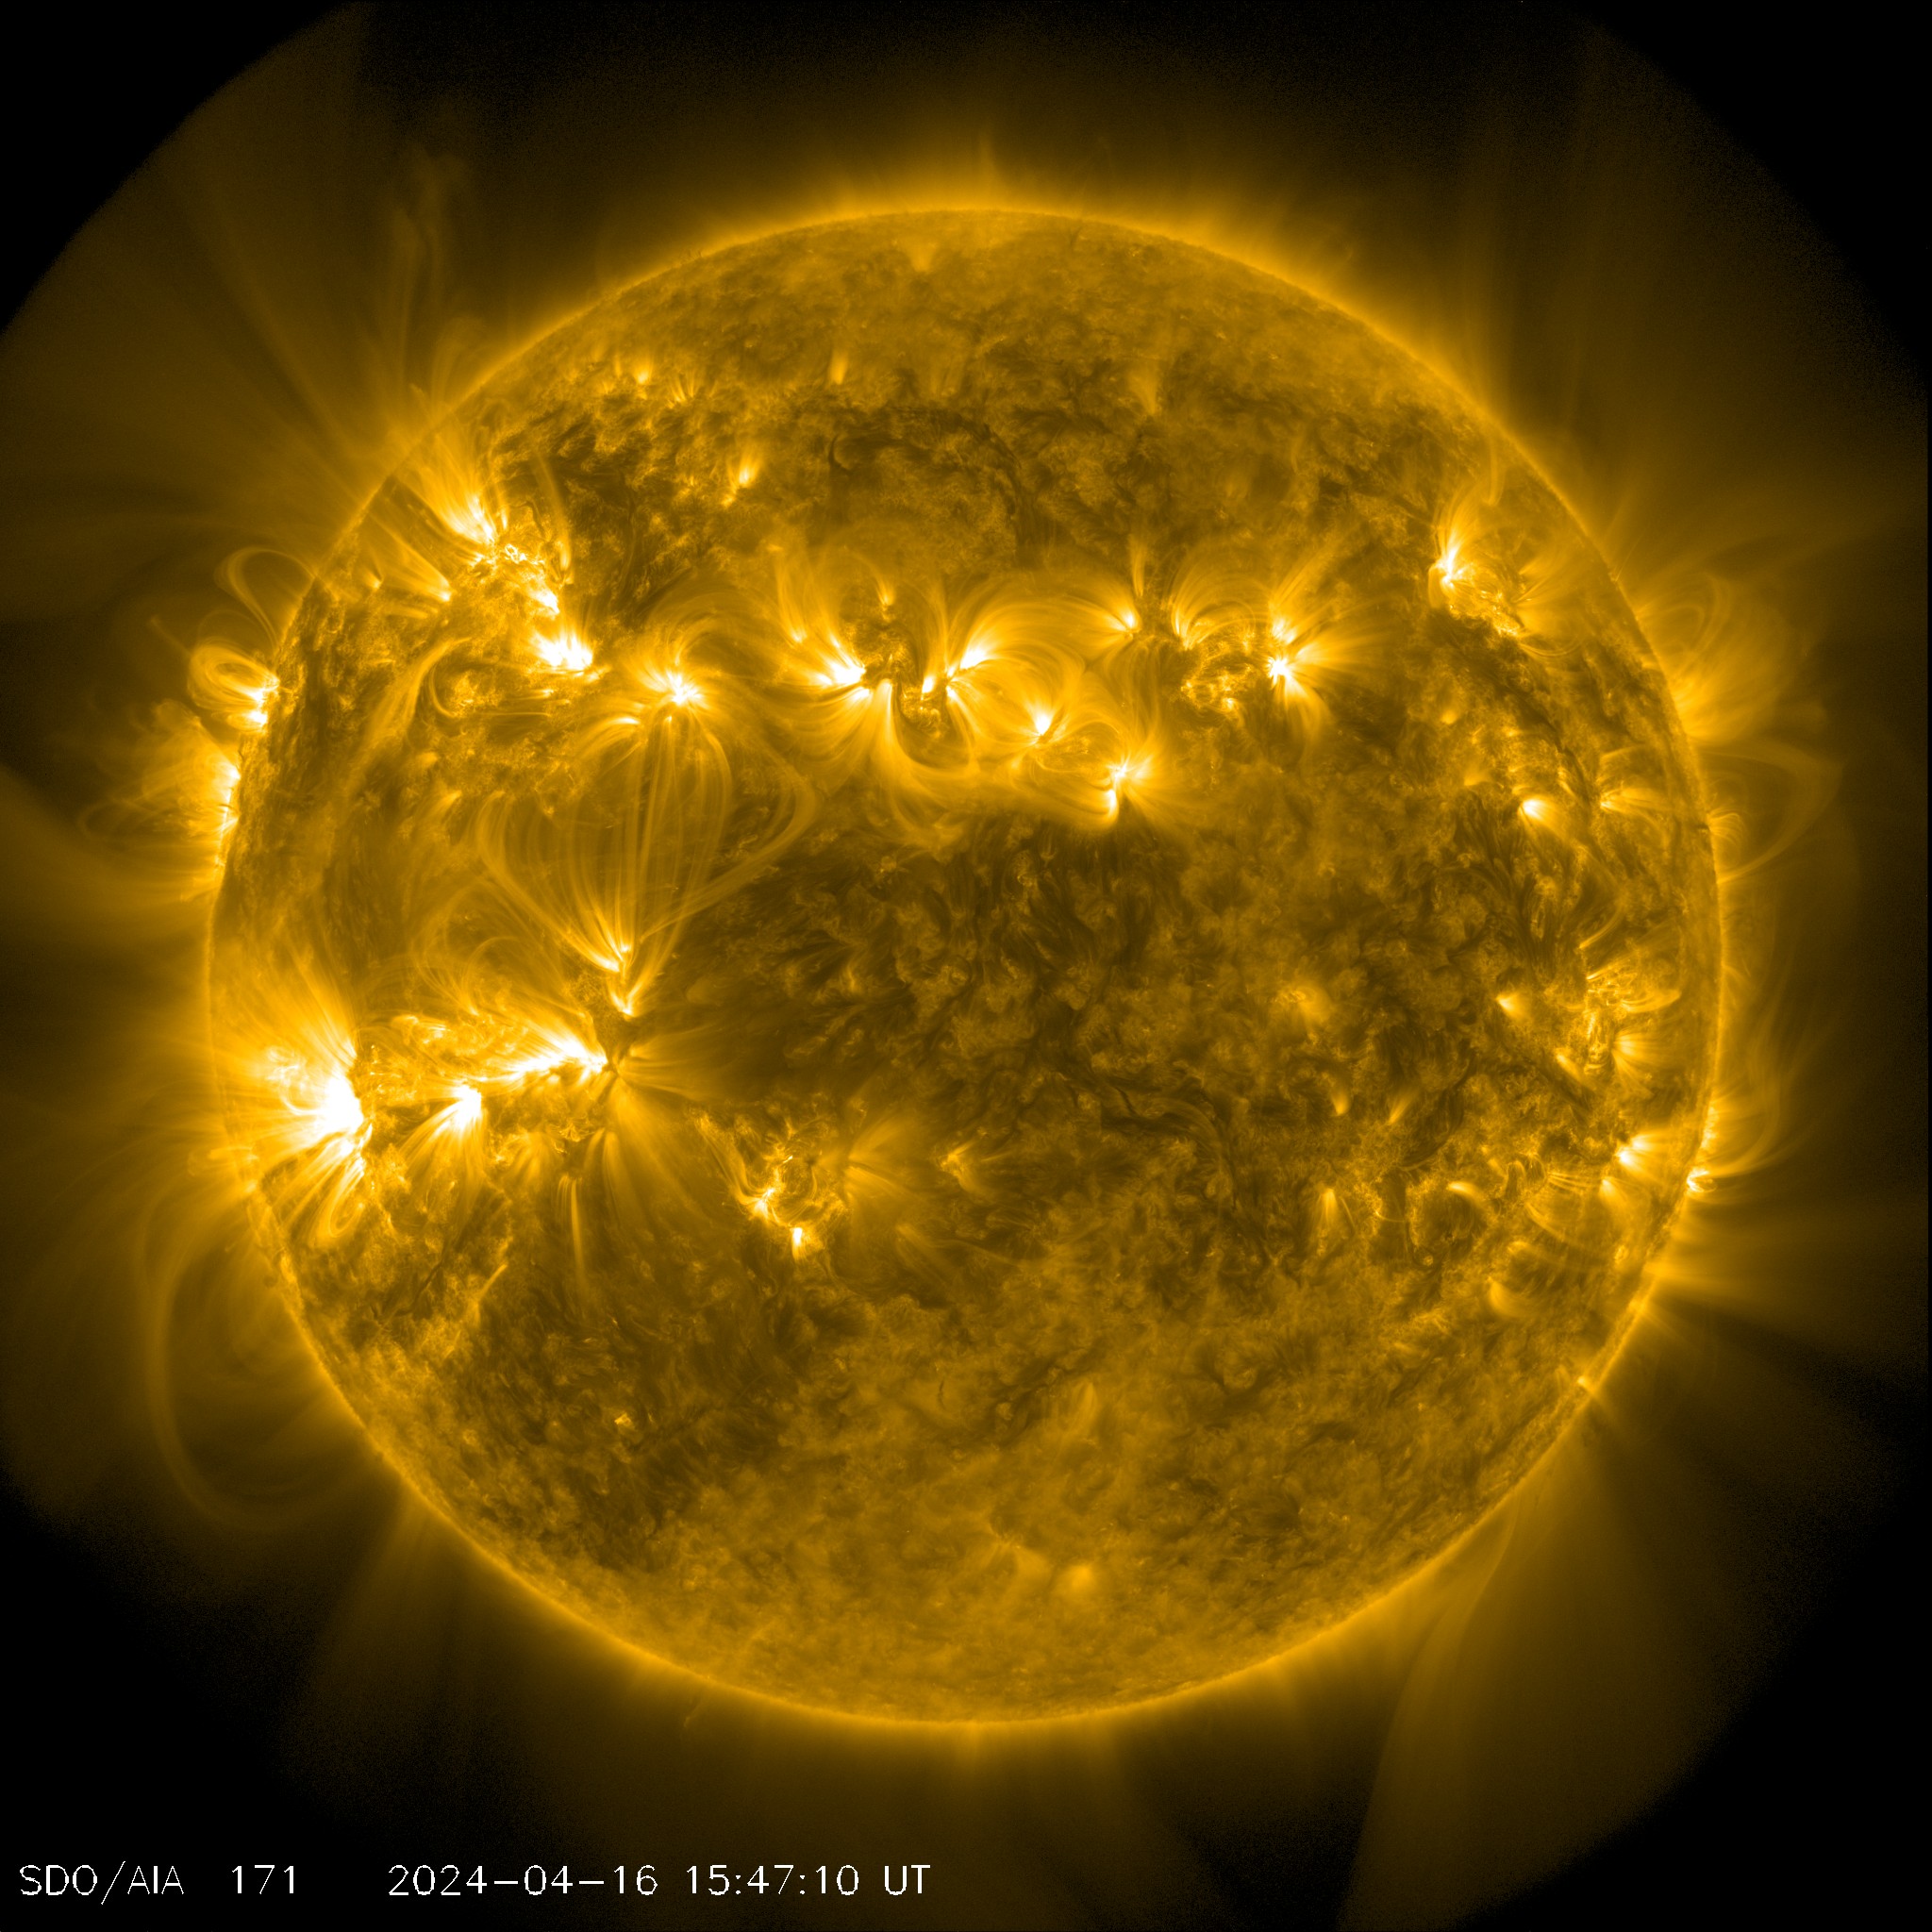 AIA 171
Emitted by iron-9 (Fe IX) at around 600,000 Kelvin. This wavelength shows the quiet corona and coronal loops, and is typically colorized in gold. Solar Region: Upper Transition Region/Quiet Corona
› View real-time AIA 171
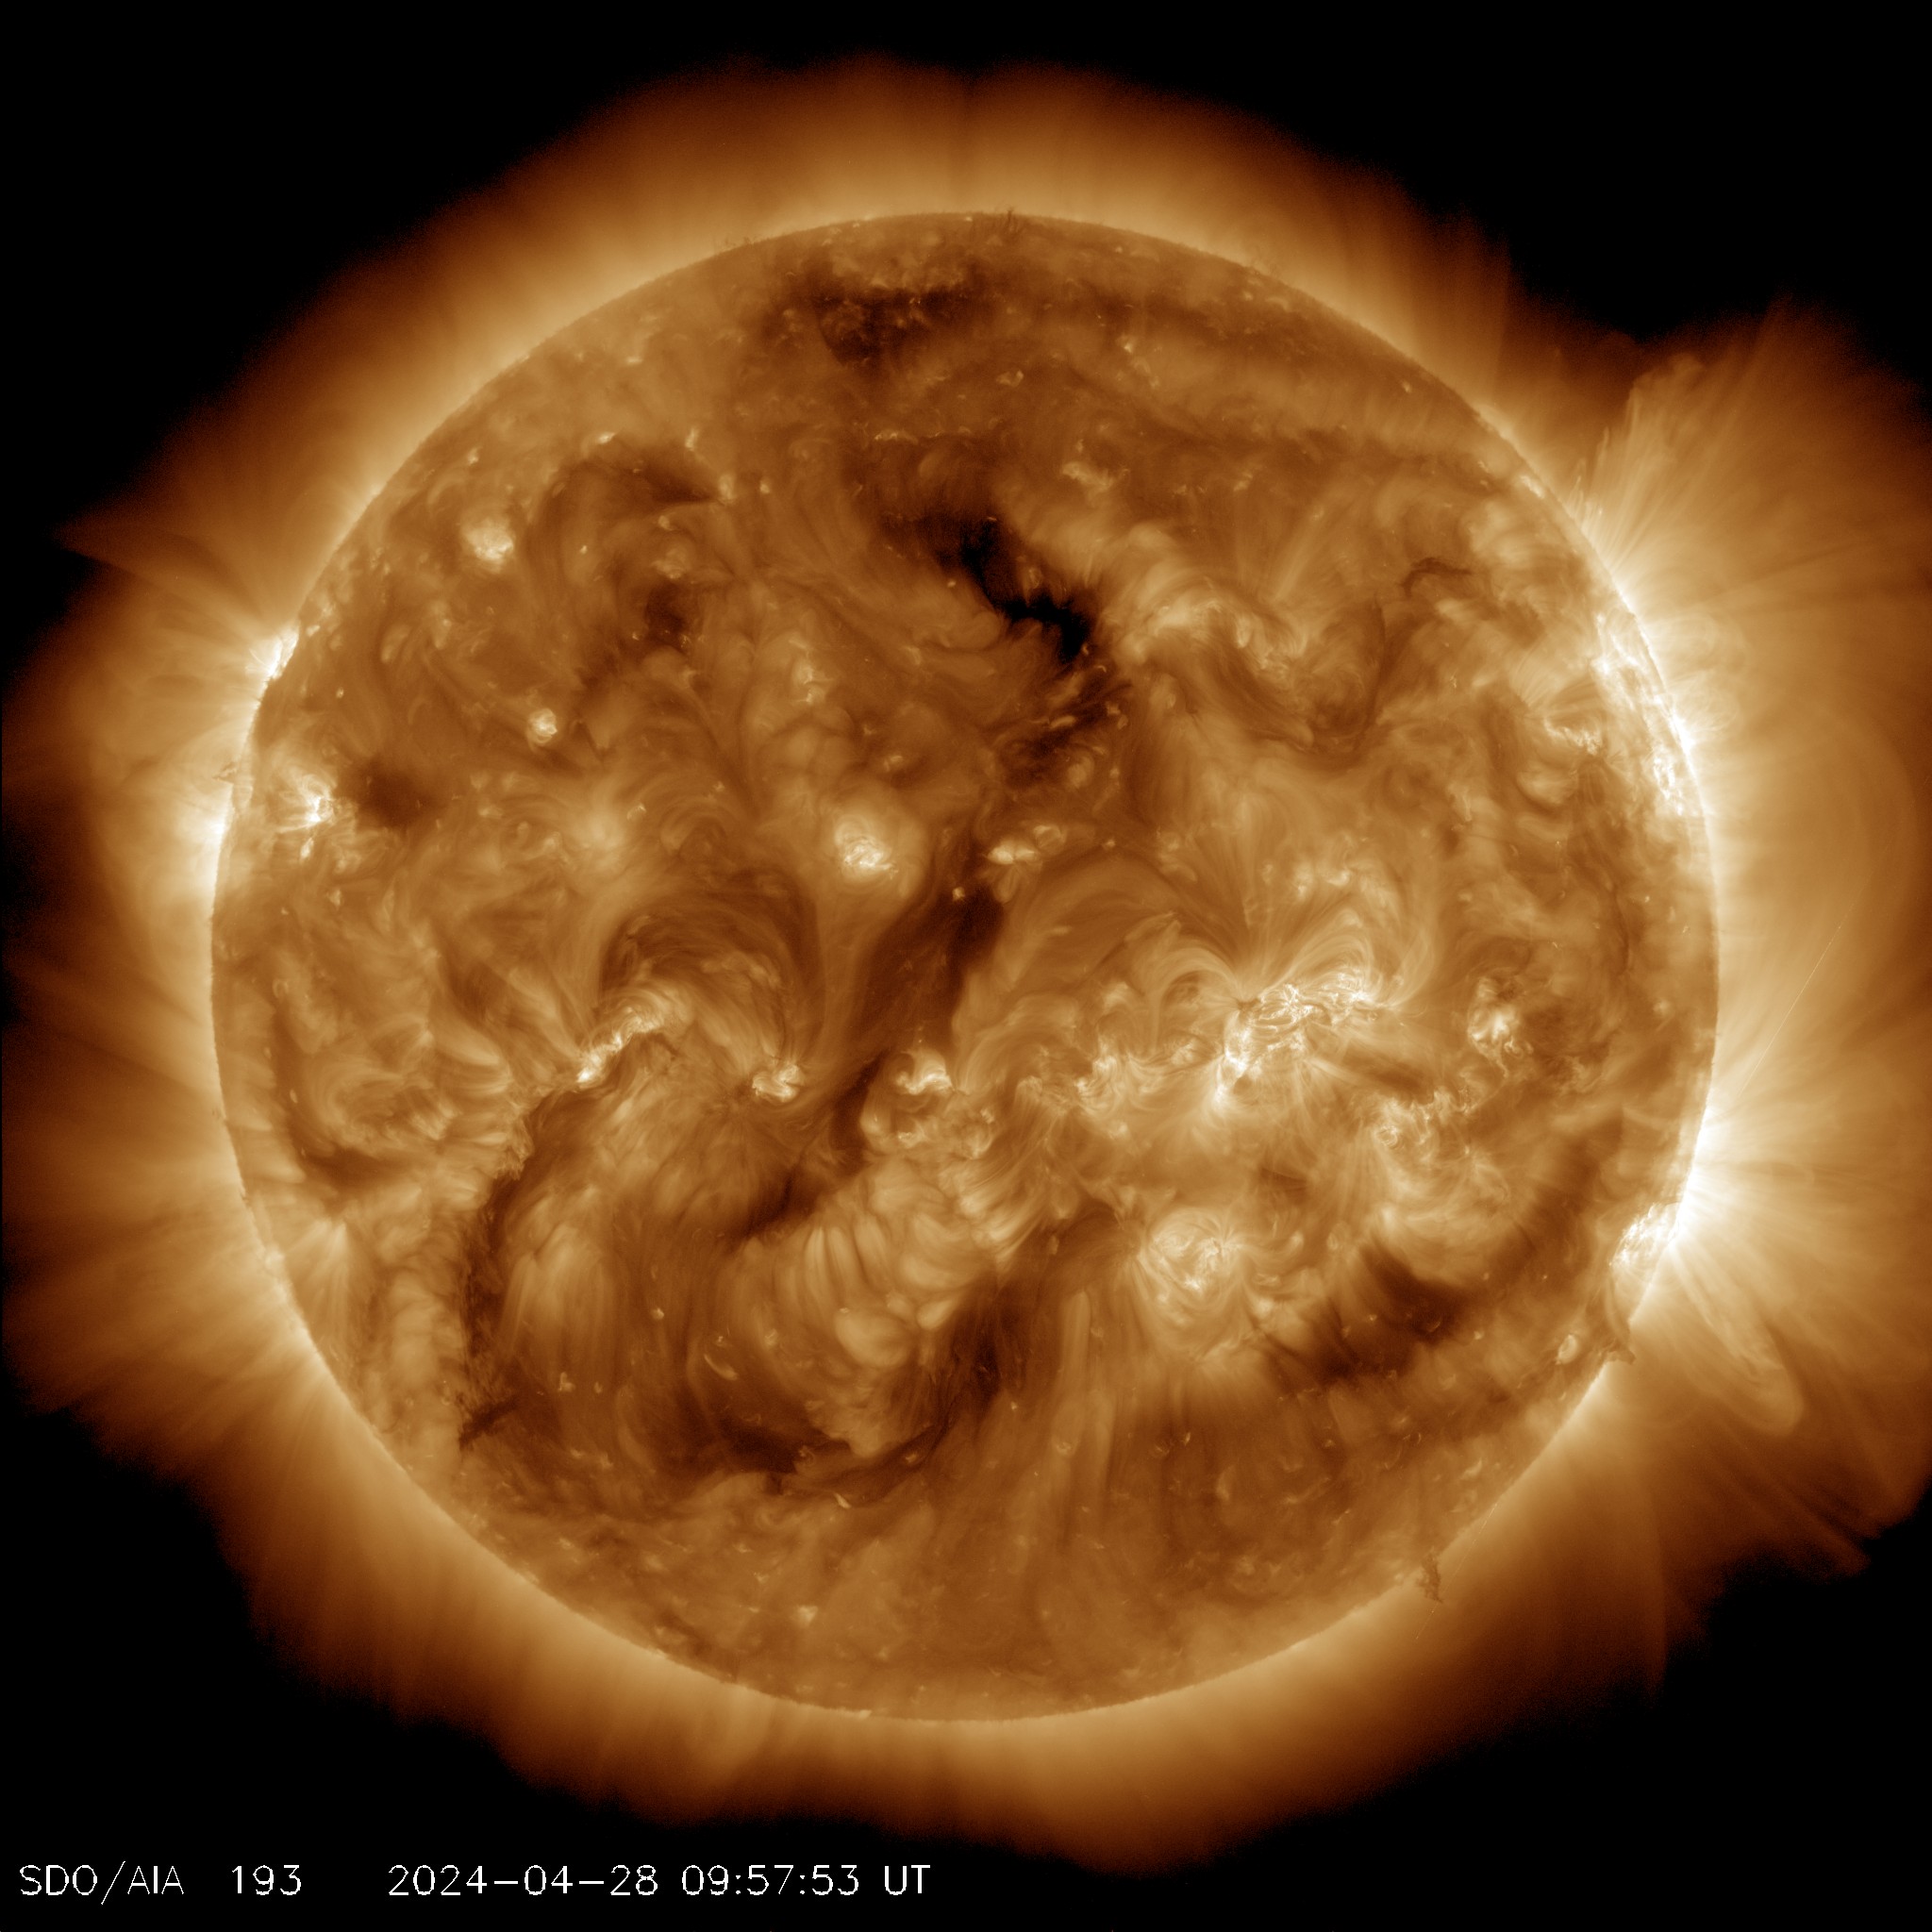 AIA 193
Emitted by iron-12 (Fe XII) at 1,000,000 K and iron 24 (Fe XXIV) at 20,000,000 Kelvin. The former represents a slightly hotter region of the corona and the later represents the much hotter material of a solar flare. This wavelength is typically colorized in light brown. Solar Region: Corona/Flare Plasma
› View real-time AIA 193
 AIA 211
Emitted by iron-14 (Fe XIV) at temperatures of 2,000,000 Kelvin. These images show hotter, magnetically active regions in the sun's corona and are typically colorized in purple. Solar Region: Active Regions
› View real-time AIA 211
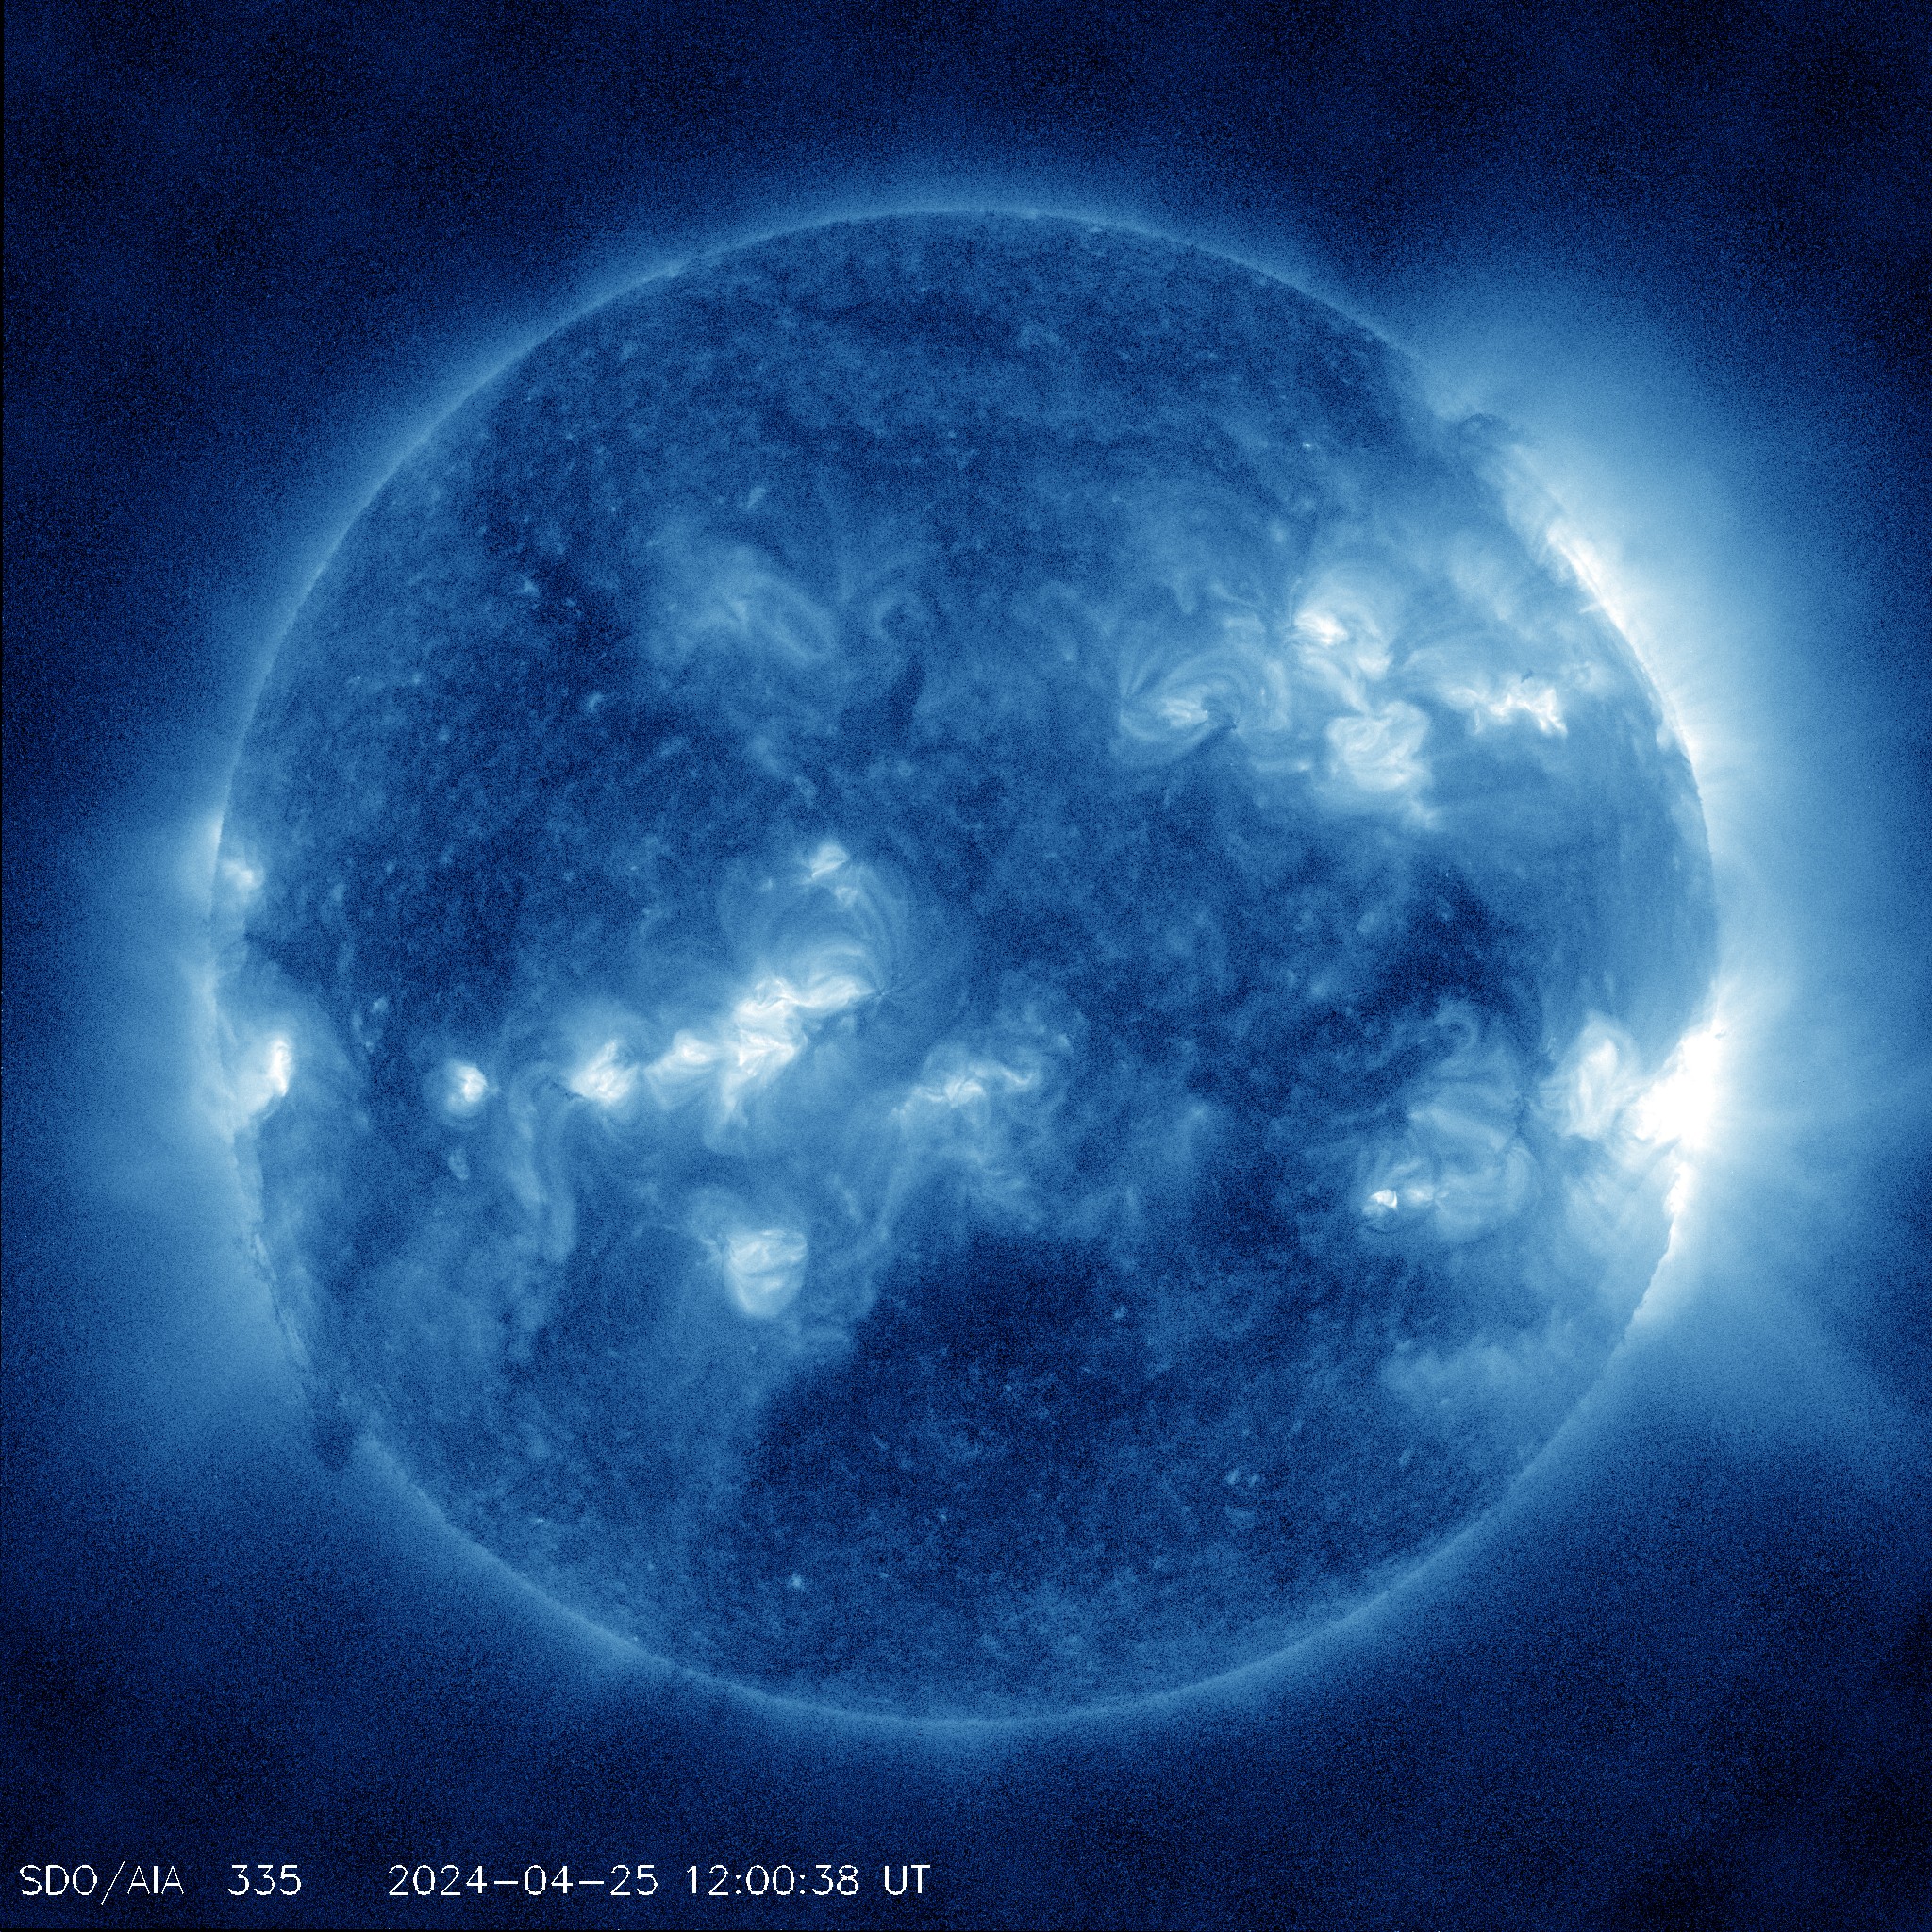 AIA 335
Emitted by iron-16 (Fe XVI) at temperatures of 2,500,000 Kelvin. These images also show hotter, magnetically active regions in the corona, and are typically colorized in blue. Solar Region: Active Regions
› View real-time AIA 335
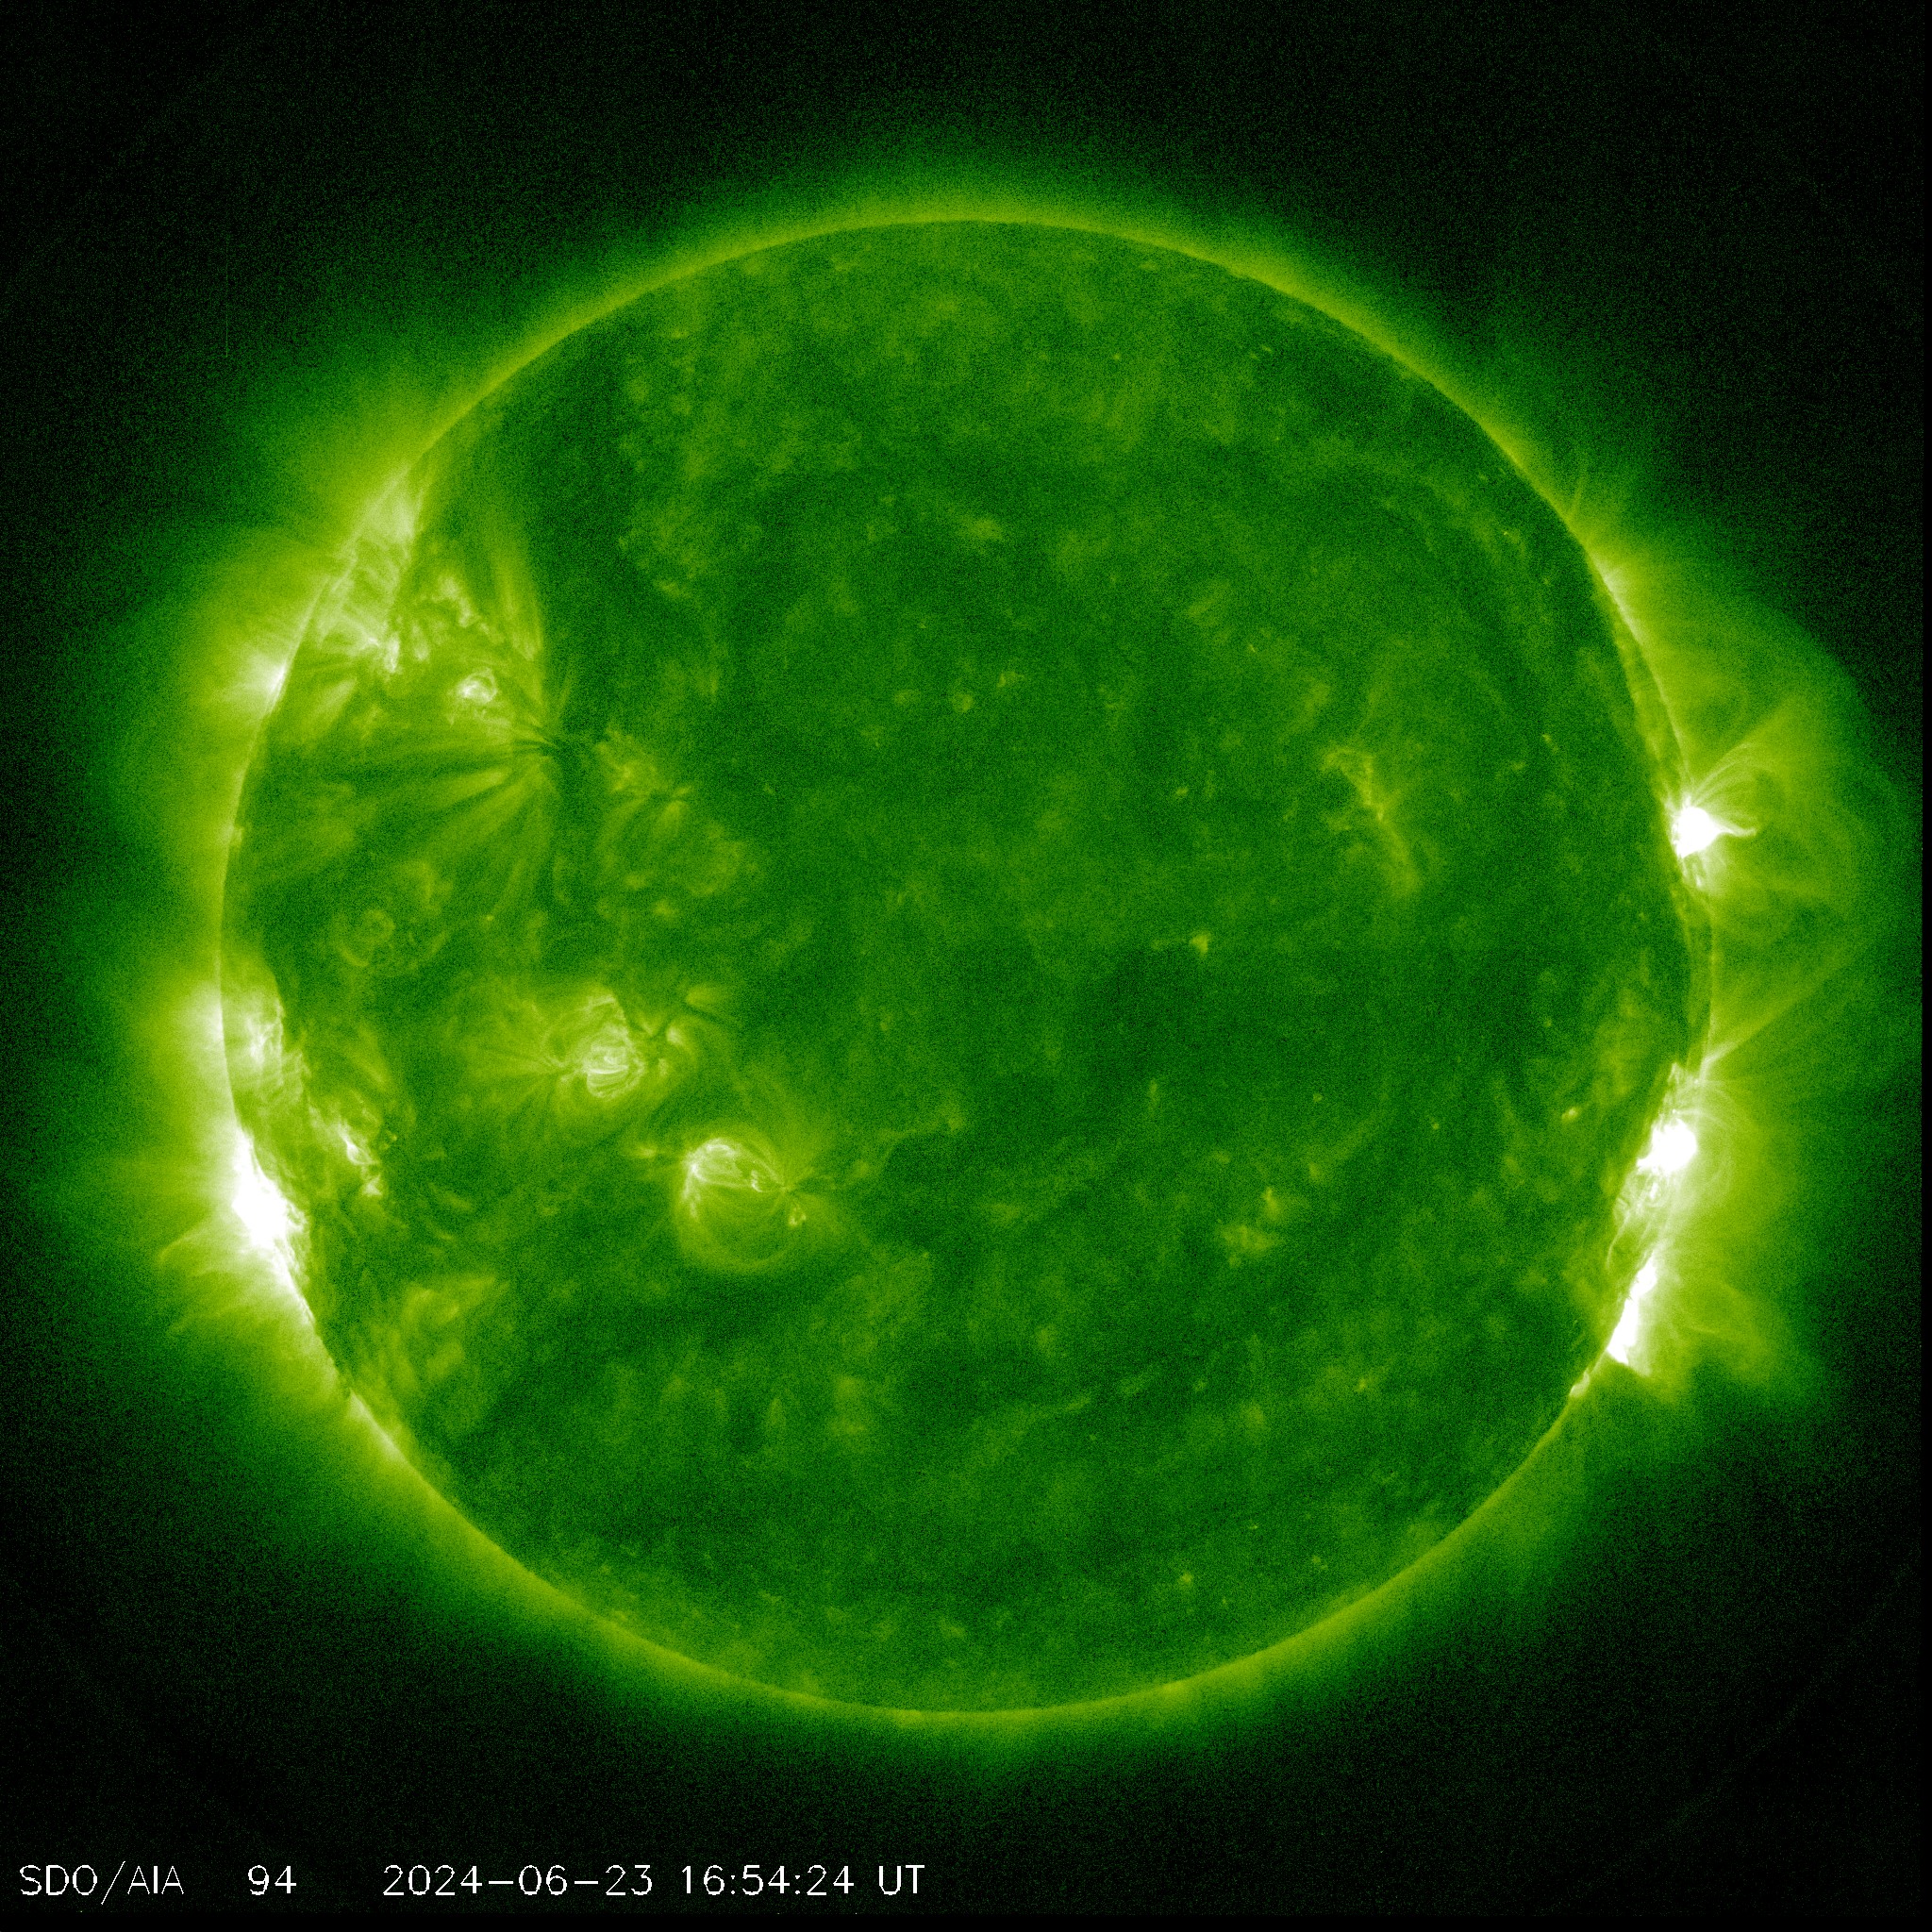 AIA 094
Emitted by iron-18 (Fe XVIII) at temperatures of 6,000,000 Kelvin. Temperatures like this represent regions of the corona during a solar flare. The images are typically colorized in green. Solar Region: Flaring Regions
› View real-time AIA 094
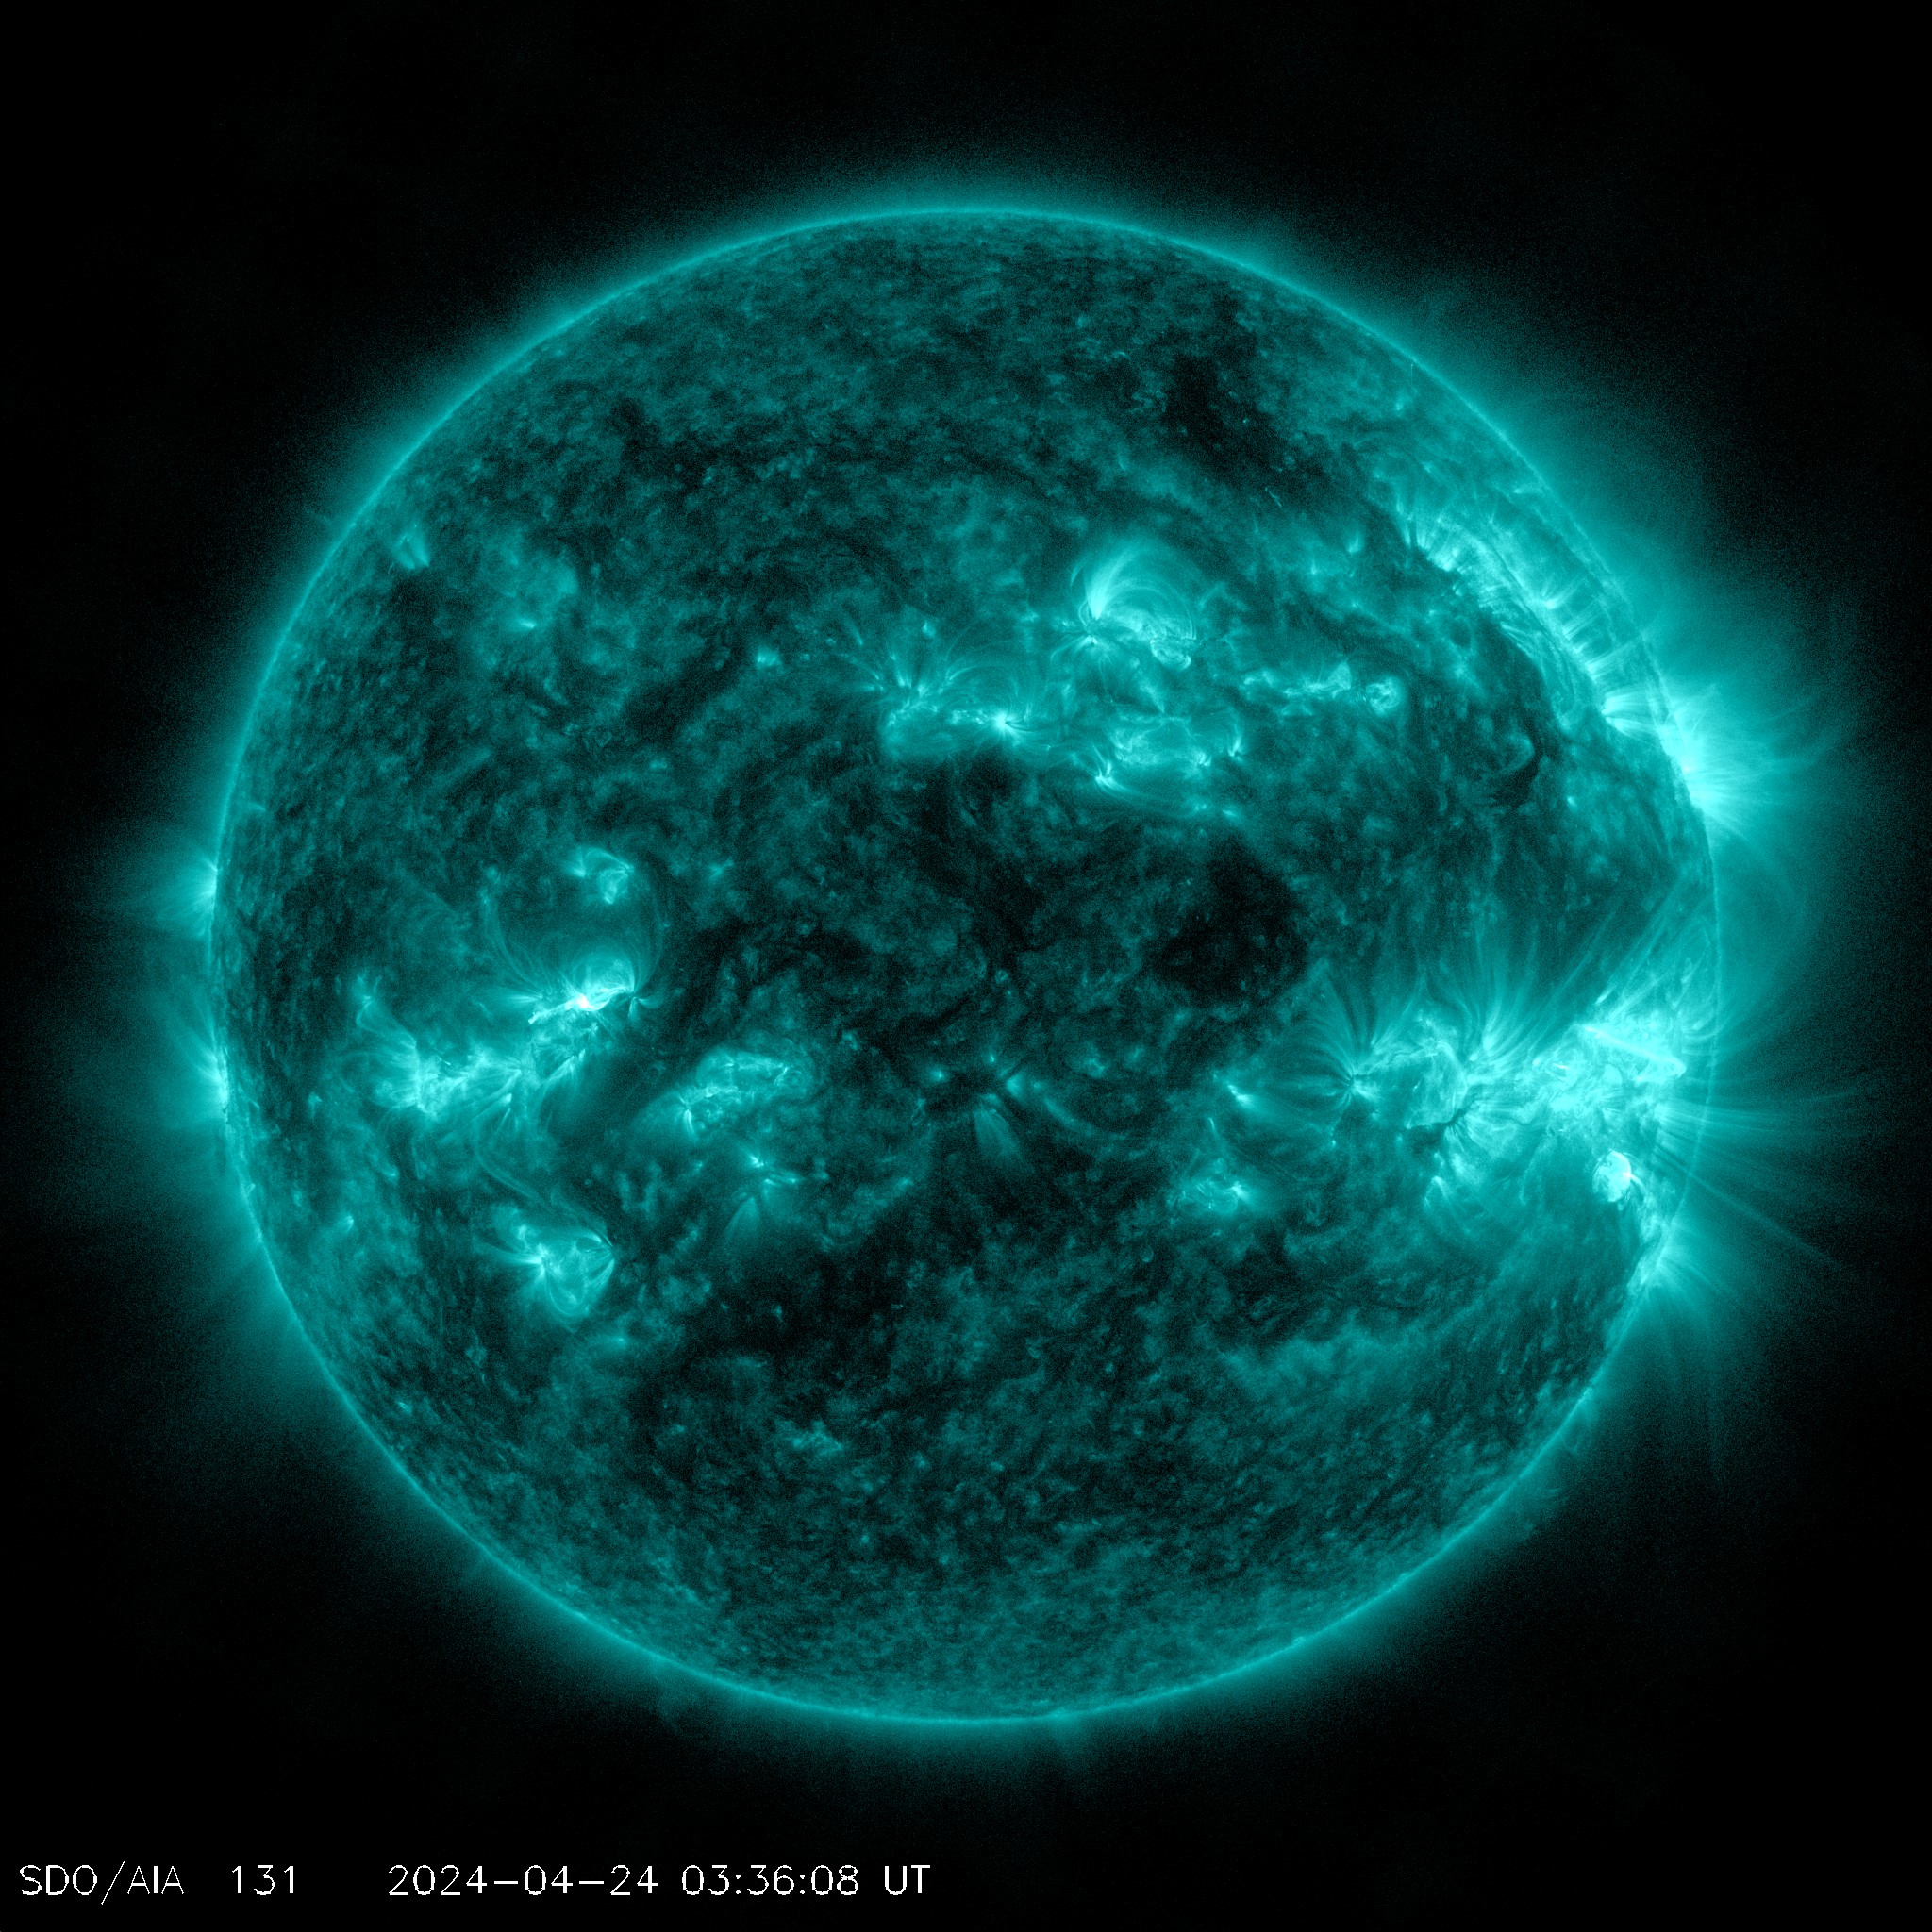 AIA 131
Emitted by iron-20 (Fe XX) and iron-23 (Fe XXIII) at temperatures greater than 10,000,000 Kelvin, representing the material in flares. The images are typically colorized in teal. Solar Region: Flaring Regions
› View real-time AIA 131
Related Links
Karen C. Fox
NASA's Goddard Space Flight Center, Greenbelt, Maryland
NASA's Goddard Space Flight Center, Greenbelt, Maryland
Last Updated: Aug. 7, 2017
Editor: Holly Zell
No hay comentarios:
Publicar un comentario